Z-Axis
In the Z-axis section of the Change Appearance dialog box, you can enter a label for the axis, define colors for the axis, and decide whether or not you want to show tick marks on the axis. This section is the same for all 3d bar charts (Bar Chart 3d and Bar Chart 3d Grouped).
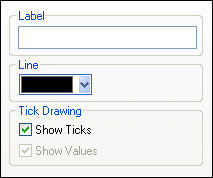
Label
The text entered into the Label field will be printed to the right of the axis as a description of the Z-axis.
Line
The axis is displayed in the color that you choose from the Line drop-down-list. You can use one of the preselected colors, or click the Other color... button to choose a standard color or define a custom color. Click the Select... button on the Custom tab and use the pipette to pick a color that is displayed somewhere on your screen.
Tick Drawing
You can switch the display of tick marks on the axis on or off.