The Tabular Report
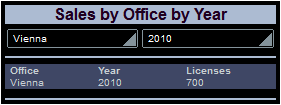
The tabular report is displayed in the table below the two combo boxes. When the end user selects the office and year for which a report is required, the tabular report displays the total sales of that year (in terms of number of licenses). The screenshot below shows the page when the solution is run.
The next screenshot shows the tabular report in the design. The table consists of two rows and four columns, with the first column being used to provide padding. Each of the remaining six cells contains a label with a text value that is either directly entered text or is calculated by an XPath expression. See each label's Text property in the Styles & Properties Pane.

The XPath expressions are as follows:
•DesiredOffice: Is taken from $DB1. It is the @City value of the Row with an @id equal to the id value of the combo box selection.
$DB1/DB/RowSet/Row[@id=$XML1/root/@DesiredOffice]/@City
•DesiredYear: Is taken from $XML1. It is the value of the @DesiredYear. The year is either selected by the end user in the combo box, or is the minimum of all unique sales years for that office.
$XML1/root/@DesiredYear
•Licenses Sold: Is taken from $DB2. Sums up all @Licenses values of the Row elements with @Office and @Year attributes equal to the values of the combo box selections. (Note that the @Office values in $DB2 are the ID values of the offices, not their city names.)
sum($DB2/DB/RowSet/Row[@Office= $XML1/root/@DesiredOffice][@Year= $XML1/root/@DesiredYear]/@Licenses)