XPath Debugger
The XPath Debugger of the XPath/XQuery Window enables you to debug XPath expressions in the context of the loaded file/s. You can open the XPath/XQuery Window via the following entry points:
•In the design, it is opened wherever an XPath expression may be entered or edited: for example, when entering expressions to set the values of styles and properties.
•From the simulator it is opened by clicking the Evaluate XPath button in the Page Sources pane.
•When the simulator stops at an action, you can start XPath Debugger by clicking the Step Into XPath button of the Actions Debugger.
Note: In the first two contexts listed above, you can enter any XPath expression you like and debug it against any XML file, which you must load into the Debugger. In the third context, however, you will be debugging the XPath expression that is specific to the current action, and you will be debugging this expression against the current action's page sources; consequently, the option to load an XML file is disabled.
The descriptions and screenshots in this section refer to the XPath Debugger when accessed via the Simulator's Page Sources pane. The Debugger behaves in the same way irrespective of the context from which it was launched. Note, however, that the option to load an XML file is disabled when the Debugger is started from the third context.
Starting XPath Debugger
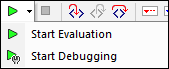
To start XPath Debugger, select Start Debugging in the Start Evaluation/Debugging dropdown menu (screenshot below). You can switch between the Builder (for help with building the expression) and the Debugger.
Either before or after entering an XPath/XQuery expression, select an XML file on which the expression is to run (see Running the Debugger below). Start debugging by clicking Start Evaluation/Debugging (F5). The Debugger will run the expression on the loaded XML file and display results in the panes in the lower part of the window.
 Buttons for setting up XPath Debugger
|
Layout of XPath Debugger
XPath Debugger has two panes that are additional to the Results pane of the Evaluator (see screenshot below):
•the Watch Expressions and Variables pane; both, variables and watch expressions, are shown in the same pane
•the Call Stack and Debug Points pane, each of which has a separate tab on the right-hand side of the pane

XPath Debugger provides the following features:
•Enables you to step into the XPath evaluation process, one step at a time to see how the XPath expression is being evaluated. Use the Step Into (F11) toolbar button for this. At each evaluation step, the part of the expression being currently evaluated is highlighted in yellow (see screenshot above), while the result of evaluating that step is shown in the Results pane. For example, in the screenshot above, all the Order elements that have a descendant element named CustomerCode containing the value '456' have been selected.
•Set breakpoints where you want to pause the evaluation and check results. Use the Start Debugging (F5) toolbar button to go through the evaluation, pausing only at breakpoints. Using breakpoints is quicker than pausing at every processing step with Step Into (F11).
•Set tracepoints to see the evaluation results at the steps marked as tracepoints. The evaluation will not pause—they pause only at breakpoints—but the tracepoint results will be displayed in a list in the Results pane.
•Watch expressions are XPath expressions that are evaluated at every step of debugging. You can use them to check information you want at each step, such as document data or aspects of the evaluation. Watch expressions are very useful when used together with breakpoints.
•Variables that are in scope at the current step, including their values, are displayed in the Watch Expressions and Variables pane.
•Processor calls of an evaluation step are shown in the Call Stack tab of the Call Stack and Debug Points pane.
•If breakpoints and tracepoints have been set, then these are displayed in the Debug Points tab of the Call Stack and Debug Points pane.
For more information about these features, see their descriptions below.
Running the Debugger
The broad steps for debugging an XPath expression are as follows:
1.Enter the XPath expression in the expression pane.
2.Make sure that the XML file on which you want to apply the XPath expression is loaded. If it is not loaded, then use the Load button (located below the Schema Tree pane; see screenshot above) to browse for the file and load it.
3.Set any breakpoints or tracepoints you want. A breakpoint is a point at which the evaluation is paused. A tracepoint is a point in the evaluation at which the result is recorded; tracepoints thus provide a traceable path of evaluation results.
4.If you click Start Debugger, evaluation is paused at the first breakpoint. Click Start Debugger repeatedly to progress through each breakpoint to the end of the evaluation.
5.Use the Step Into/Out/Over functionality to go step-by-step (as opposed to breakpoint-by-breakpoint) through the evaluation.
6.You can also run the debugger up to a point in the XPath expression: (i) Mark the point by placing your cursor at that location, and (ii) click the Run to Cursor toolbar icon.
|


Stepping into, out of, and over evaluation steps
The Step Into functionality enables you to go step-by-step through the evaluation. Each click of this command takes you through the next step of the evaluation; the current step is shown by the highlighting in the expression (see screenshot below). The Step Out functionality takes you to a step on a higher level as the current step, whereas the Step Over functionality steps over lower-level steps and takes you to the next step on the same level. You can try out the Stepping functionality by using the expression shown in the screenshot below ($ORDERS/Orders/Order[CustomerCode="456"]/@number) and clicking the three Step buttons to see how they work. (The XML file in this example is a page source of the tutorial SubPages-And-Visibility. Open this file and do the following: (i) Start the Simulator; (ii) On the top page that appears in the Simulator, click Show All Orders, (iii) In the Page Sources pane of the Simulator, click the Evaluate XPath toolbar icon, (iv) switch to the Debugger (see above).)
The screenshot below shows the evaluation when processing has been paused on reaching the locator step Order[CustomerCode='456']. At this step, the result shows the two Order elements that each have a CustomerCode child element containing the value '456'. The two elements (with their entire node contents) are displayed in the Results pane.

Breakpoints
Breakpoints are points where you want the Debugger to stop after it has been started with Start Debugger. They are useful if you wish to analyze a specific part of the expression. When the Debugger stops at the breakpoint, you can check the result and could then use the Step Into functionality to display the results of the next steps of the evaluation. To set a breakpoint, place the cursor in the expression at the point where you want the breakpoint, and click the Insert/Remove Breakpoint (F9) toolbar button. The breakpoint will be marked with a dashed red overline. To remove a breakpoint, select it and click Insert/Remove Breakpoint (F9).
Note: You can make a breakpoint conditional by entering the condition on the breakpoint's listing in the Debug Points pane. See Debug Points below.
Note: You can start XPath Debugger directly from a simulation to debug XPath expressions that have breakpoints set on them. To do this start MT Debugger in Breakpoints Mode.
Tracepoints
Tracepoints are points at which the evaluation results are recorded. These results are displayed in the Traces tree of the Results pane (see screenshot below). Tracepoints enable you to see the evaluation results of particular parts of the expression. For example, in the screenshot below, tracepoints have been set on the OrderAmount node. The results at these tracepoints are shown in the Traces tree.
To set a tracepoint, place the cursor at the point where you want the tracepoint, and click the toolbar button Insert/Remove Tracepoint (Shift+F9). The tracepoint will be marked with a dashed blue overline (see screenshot below). To remove a tracepoint, select it and click Insert/Remove Tracepoint (F9).

Note: If both a breakpoint and a tracepoint are set on the same part of an expression, then the overline is composed of alternating red and blue dashes.
Also see Debug Points below.
Watch Expressions, Variables and Call Stack
Watch expressions and variables are displayed in the Watch Expressions and Variables pane (bottom center pane in the screenshot below). In this pane, you can filter the view to show/hide (i) the current context item, (ii) local variables, (iii) global variables. Do this by toggling on/off the respective toolbar icons. The current context item is the node that is currently being evaluated.

Watch expressions
Watch expressions are XPath expressions that you can enter, either before evaluation starts or during a pause in evaluation. The expression is evaluated in the context of the current node at each evaluation step where the debugger stops. Watch expressions can be used for the following purposes:
•To test specific conditions. For example in the screenshot above, the watch expression $i/CustomerCode="789" is used to test whether the current Order element has a CustomerCode with a value of "789". The result false in the case of the first Order element tells us that this order does not have a CustomerCode value of "789". (The value is "456" as can be seen in the Results pane.)
•To find data within a certain context. For example, in the screenshot above, we have entered the watch expression $i/CustomerCode, $i/OrderDate to look up these details of the current order.
•To generate additional data. For example, in the screenshot above, we have entered the watch expression count($ORDERS//Order) to count all the Order elements.
To enter a watch expression, click Add Watch in the pane's toolbar, then double-click the new watch entry to enter the XPath expression and click Enter when done. To remove a watch expression, select it and click Remove Watch in the toolbar. If, during debugging, the expression cannot be correctly evaluated for some reason (for example, if one of its variables is out of scope), then the watch expression turns red.
Variables
Variables that have been declared in the expression and that are in scope in the current evaluation step will be displayed together with their respective current values. They are displayed below the watch expressions.
In the screenshot above, for example, processing has been paused at the breakpoint on the variable $i. The $i variable is in scope at this evaluation step. So $i is displayed with its current value, which in the screenshot above is the first Order element. Since the document's root node, $ORDERS, is also a variable, it is also displayed with its content, which is the document root.
Call stack
The Call Stack tab of the Call Stack and Debug Points pane (bottom right pane in the screenshot above) displays the processor calls up to that point in the debugging. The current processor call is highlighted in yellow. Note that only the calls that directly led to the current evaluation step are displayed.
Debug Points
The Debug Points tab of the Call Stack and Debug Points pane (bottom right pane in the screenshot below) shows the breakpoints (with solid red circles) and tracepoints (solid blue circles) that you have set on the expression. Each debug point is listed with its line and character number. For example, AxisStep@2:12 means that there is a debug point on line 2, character 12 of the expression in the expression pane.
To stop at each breakpoint in the expression, click Start Debugger (F5).

Note the following features:
•You can make each breakpoint conditional on some factor by entering a break condition for it. Do this in the Debug Points pane by (i) double-clicking the breakpoint's Enter break condition entry, (ii) entering the expression for the condition, and (iii) pressing Enter. That breakpoint will be enabled only when the condition evaluates to true. For example, in the screenshot above, the break condition $i/CustomerCode="456" will enable the breakpoint on $i (that is, the current Order element) when the Order element's CustomerCode child element has a value of "456". In effect, processing will pause only at those orders that have a customer code of 456. The screenshot shows the evaluation paused at the sixth order, which is such an order. The breakpoint is not triggered for orders with other customer codes. (You can set a watch expression, as in the screenshot above, to show which orders have a customer code of 456: the orders with the numbers 001 and 006.)
•You can enable/disable all debug points by clicking their respective toolbar buttons: Enable All Debug Points and Disable All Debug Points (buttons encircled in green in the screenshot above). When a debug point is disabled, it is deactivated for all evaluations till it is enabled again.
•You can enable/disable individual breakpoints in their respective context menus.
•Tracepoints are simply listed with their details. They can be enabled/disabled.
•If you click Clear All Debug Points, then all breakpoints and tracepoints in the design will be removed.
•If an error occurs, for which no handling has been defined, this can be picked up. Simply switch on the Break on Unhandled Error toggle command in the toolbar. The Debugger will break on such errors.
Toolbar commands in panes
The panes of the XPath/XQuery Window in Debug Mode (see screenshot above) contain buttons that provide navigation, search, and copy functionality. These buttons, starting from the leftmost in each pane, are described in the table below. The corresponding commands are also available in the context menu of listed items.
Icon | What it does |
Next, Previous | Selects, respectively, the next and previous item in the result list |
Copy the selected text line to the clipboard | Copies the value column of the selected result item to the clipboard. To copy all columns, toggle on the Copying includes all columns command (see below) |
Copy all messages to the clipboard | Copies the value column of all result items to the clipboard, including empty values. Each item is copied as a separate line |
Copying includes all columns | Switches between copying (i) all columns, or (ii) only the value column. The column separator is a single space |
Find | Opens a Find dialog to search for any string, including special characters, in the result list |
Find previous | Finds the previous occurrence of the term that was last entered in the Find dialog |
Find next | Finds the next occurrence of the term that was last entered in the Find dialog |
Clear | Clears the result list |
Closing the XPath Debugger
To close the XPath Debugger, click Stop Evaluation/Debugging.