Breakpoints Pane
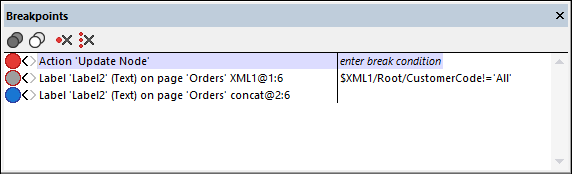
The Breakpoints Pane (screenshot below; see User Interface for its location) lists all the project's breakpoints and tracepoints and provides a convenient single place to manage these debug points. Breakpoints can be set on actions and XPath expressions, and are indicated by a solid red circle. Tracepoints can be set on XPath expressions, and are indicated by a solid blue circle. Both types of debug points may be disabled, in which case they are ignored during debugging sessions; disabled debug points are indicated by a solid gray circle with a border color that indicates which type of debug point it is (red for breakpoints, blue for tracepoints).
The following features are available:
•To filter what types of debug points are shown, right-click in any free area of the pane.
•To enable/disable individual debug points: (i) click its circle indicator, or (ii) right-click the debug point and toggle the Enabled command on/off.
•To enable/disable all debug points, click the respective tool bar icon.
•To remove individual debug points: (i) right-click the debug point and select Delete, or (ii) select the debug point and click the toolbar icon Clear This Debug Point.
•To remove all debug points, click the toolbar icon Clear All Debug Points.
•You can enter a break condition, which is an XPath expression that must evaluate to true() for the breakpoint to be enabled. To set a break condition for a given breakpoint, double-click Enter break condition in that breakpoint's right-hand column. Alternatively, right-click the breakpoint and select Edit. The second breakpoint in the screenshot above has a break condition. Note that break conditions are available for breakpoints only, not for tracepoints.