Chart Data Selection
This topic contains simple examples to illustrate how chart data selection works.
 XML file used in chart examples: YearlySales.xml
<?xml version="1.0" encoding="UTF-8"?> <Data xmlns:xsi="http://www.w3.org/2001/XMLSchema-instance" xsi:noNamespaceSchemaLocation="YearlySales.xsd"> <Region id="Americas"> <Year id="2005">30000</Year> <Year id="2006">90000</Year> <Year id="2007">120000</Year> <Year id="2008">180000</Year> <Year id="2009">140000</Year> <Year id="2010">100000</Year> </Region> <Region id="Europe"> <Year id="2005">50000</Year> <Year id="2006">60000</Year> <Year id="2007">80000</Year> <Year id="2008">100000</Year> <Year id="2009">95000</Year> <Year id="2010">80000</Year> </Region> <Region id="Asia"> <Year id="2005">10000</Year> <Year id="2006">25000</Year> <Year id="2007">70000</Year> <Year id="2008">110000</Year> <Year id="2009">125000</Year> <Year id="2010">150000</Year> </Region> </Data>
|
|
|
Chart data selection with four XPath expressions
The screenshot below shows the Chart Configuration dialog, at the bottom of which is the Chart Data Selector pane with fields for entering the four XPath expressions for data selection.
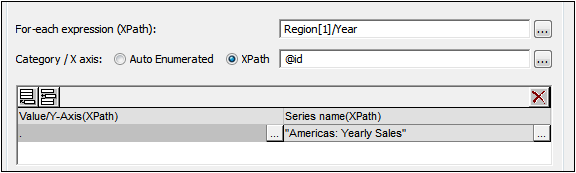
The four XPath expressions in the Chart Data Selector pane work together and do the following:
XPath | Description |
For-Each | •Sets the context for the other three XPath expressions •Sets the number of items in the returned sequence as the number of ticks on the X-Axis. •In the case of the screenshot above, the Region[1]/Year expression returns six node items; so there will be six ticks on the X-Axis (see screenshot below). |
X-Axis | •The items in the returned sequence provide the label text for the corresponding ticks on the X-Axis. •In the example shown above, the @id expression returns the id attribute value of each Year element. These values become the labels of the corresponding ticks (see screenshot below). •Since we have specified that this will be a bar chart, bars are drawn at the ticks. |
Y-Axis | •The Y-Axis can display multiple series, each of which is defined in one row of the Y-Axis table. •Each series is defined by two XPath expressions: one for the series value, the other for the series name. •In our example, the self::node() XPath expression (indicated by its abbreviated form of a period) selects the current node, which is the Year element that is the context node. So, for each Year element (represented by a bar on the X-Axis), the Year element's content will be read as the Y-Axis value of that year, and therefore plotted as the height of the bar (see screenshot below). The screenshot further below shows a chart with multiple series on the Y-Axis. |
Series name | •This expression provides the legend text for the series. In our example, the legend text (which appears at the bottom of the chart, screenshot below) is obtained from an XPath expression that is a text string (see screenshot above). |
A bar chart that is generated for the data selection shown in the screenshot above and the XML data in YearlySales.xml looks like the chart in the screenshot below.
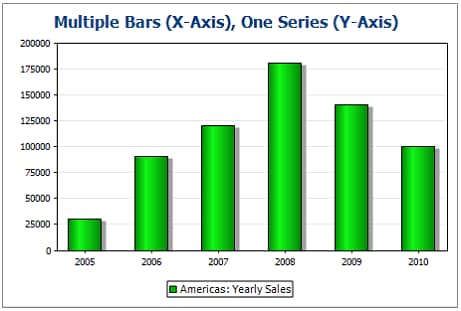
The screenshot above shows a bar chart with a single series, while that below is of a stacked bar chart with multiple series. In the latter example, the value of each series is stacked on to the bar.
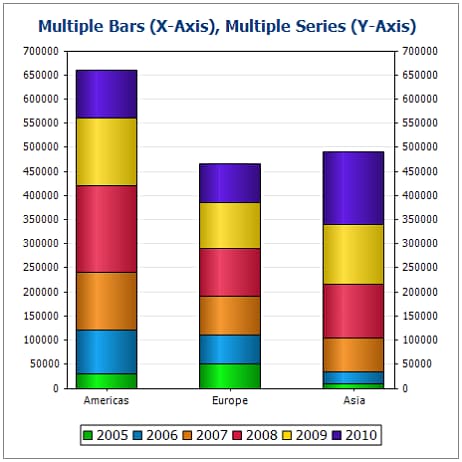
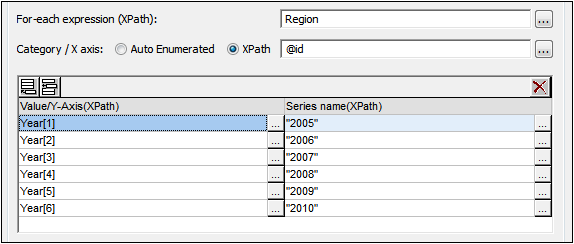
The XPath expressions of this chart are shown in the screenshot below.
Note: Pie charts and gauge charts have a single nominal series, which requires no name. So if a series name is entered in the data selection, it is ignored. For ungrouped bar charts, however, the name of the single series, if present, is used for the legend. For gauge charts, in addition to any Series Name entry being ignored, the X-Axis data selection is also ignored; only the Y-Axis selection is used for gauge charts.