Messages Pane
While the simulation progresses, the Messages Pane of the MobileTogether Designer GUI provides a detailed and step-by-step report of all the solution-related activity taking place, and the time taken for each action. You can clearly see what is happening at each step in the progress of the workflow: what is executed on the server, what on the client, what is the order of the flow of actions, and why the actions happen the way they do. Server and client actions are displayed with different background colors. Errors are flagged, and warnings and traces are also displayed. All of this is absolutely necessary and extremely useful for testing and debugging design files.
•Simulation on the designer reports activities on both server and client.
•Simulation on the server reports client messages.
•Simulation on the client reports server messages.
The screenshot below shows a simulation that was completed without any error. At each step of the workflow, messages detailing the actions taking place on server and/or client are displayed, as well as the time taken for the different executions. Messages about actions that are executed on the server and on the client are displayed in different background colors (green and pink, respectively, in the screenshot below). This helps you to quickly see where the various actions are taking place. (The background colors can be modified according to your preference.) Links in the Messages Pane take you to the relevant component in the design or the Page Sources Pane. Hovering over a message pops up additional information about that particular workflow activity. When the simulation ends, a summary of errors and warnings is displayed (highlighted in the screenshot below).

If an error occurs, it is flagged with a red icon (see screenshot below).

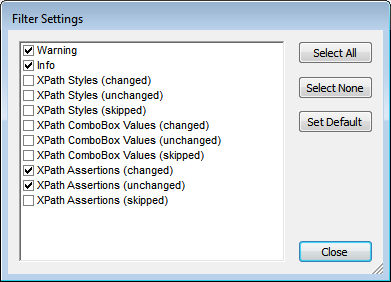
Filtering messages
You can specify what kind of messages are displayed in the Messages Pane. To do this, click the Filter button in the toolbar of the Messages Pane (screenshot above). This displays the Filter Settings dialog (screenshot below). Select the message types you want to display and click Close. This feature can be very useful, for example, if there are too many messages and you wish to focus on just one type of message.
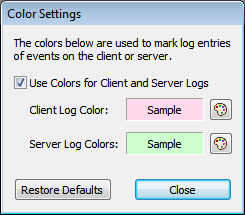
Color settings
For messages that are displayed during simulations, different colors can be set for actions that take place on the server and on the client. If you set clearly distinguishable colors, you can very easily follow the workflow in the Messages Pane. This can be of great help in debugging. To set customs colors, click the Colors button in the toolbar of the Messages Pane (screenshot above). This displays the Color Settings dialog (screenshot below), in which you can set the colors you want.
For more information, see the Messages Pane.