Actions Debugger
The Actions Debugger enables you to debug the actions of a control event or page event. It is opened when an action that has been selected for debugging is encountered during a simulation. The debugging of actions enables you to do the following: (i) view the callstack of actions, (ii) view how the values of variables are updated during the execution of actions, and (iii) set watch expressions to test or investigate aspects of the action execution.
Usage
Usage of the Actions Debugger consists of two steps:
1.Select the action/s to be debugged
2.Start a simulation and run the Actions Debugger on the selected actions
Select the action/s to debug
Selection is done in two ways:
•By setting a breakpoint on each action you want to debug. If you then run a simulation in Breakpoints Mode, the Actions Debugger will automatically open to debug actions that have breakpoints. (In Breakpoints Mode, XPath Debugger will be opened to debug any XPath expression that contains a breakpoint.)
•By directly selecting, during a simulation, the next action to debug. This is Actions Mode.
Setting breakpoints on actions
You can set a breakpoint on an action in two ways:
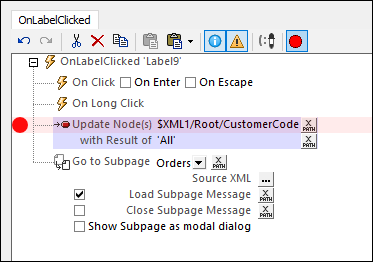
•On an action's definition, by clicking the toolbar command Toggle Breakpoint (screenshot below) to toggle the breakpoint on. To remove the breakpoint, click Toggle Breakpoint again.
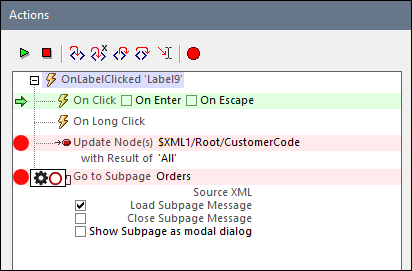
•During an action debugging session you might find that you want to set or remove breakpoints for future debugging sessions. This is possible without you having to close your current debugging session. In the Actions Debugger (screenshot below), select the action for which you want to set/remove a breakpoint, and click the toolbar command Toggle Breakpoint.
The following options are available when you place the mouse cursor over a breakpoint's symbol (the red circle):
•Click the gear symbol in the popup to make the breakpoint conditional. The condition is specified as follows: (i) via an XPath expression, and (ii) via the hit count (the number of times the action has been executed). For example, you can specify that the breakpoint is active when the the hit count is equal to 3, which will result in the breakpoint being active the third time the action is executed.
•Click the outlined-circle toggle in the popup to disable/enable the breakpoint.
A plus symbol appears inside the red circle symbol of the breakpoint when the breakpoint has been made conditional. This symbol disappears when the conditionality is removed.
Note: You can remove a breakpoint by clicking it, or by selecting the respective action and clicking the Toggle Breakpoint icon in the toolbar of the pane.
Select an action during simulation
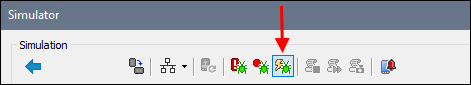
Besides using breakpoints to select an action for debugging, you can also, during a simulation, use the simulator's Stop at Next Action toolbar icon (see screenshot below) to select actions for debugging. The selected actions in this case will be the actions of the next event to be triggered in the simulation.
When the next event is triggered in the simulator, the Actions Debugger will open, and you can start debugging the actions that were defined for that event. How the Actions Debugger works is explained below.
Running the Actions Debugger
The Actions Debugger can run in Breakpoints Mode (debugs actions having breakpoints) or Actions Mode (debugs actions of the next event to be triggered in the simulation).
After you have set any breakpoints that you want to set on actions (see section above), in the simulator select the debugger mode you want (Breakpoints or Actions) and then start or resume the simulation. When the simulation reaches an action selected for debugging, the Actions Debugger appears.
The Actions Debugger (screenshot below) consists of two panes:
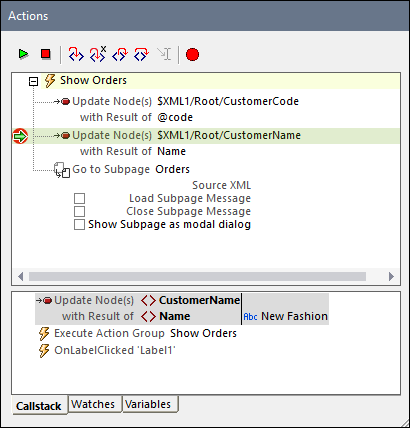
•An upper pane, which displays the action/s that have been selected for debugging. The screenshot below, for example, shows the two actions that have been set on the OnLabelClicked event of a Label control named Label9. These actions are an Update Node action and a Go to Subpage action.
•A lower pane, which has three tabs: (i) Callstack, (ii) Watches, (iii) Variables (described below).
•You can start debugging by using the toolbar icons
•The action being currently debugged is indicated by a green highlight and green arrow at left (see screenshots in this topic)
•The toolbar icons (see screenshot above) are, from left to right:
❖Resume Debugging / Go: Starts/Continues the debugging.
❖Stop Debugging: Stops debugging and closes the Actions Debugger. You will be prompted to choose whether you want to (i) stop the debugging and the simulation; (ii) stop the debugging and the simulation, and edit the action; (iii) cancel the stop action and continue with debugging.
❖Step Into Action (F11): Proceeds through the action execution, one step at a time.
❖Step Into XPath (Ctrl+Shift+F11): Opens the XPath Debugger and displays the XPath expression of the action.
❖Step Out (Shift+F11): Steps out of the current execution step, and goes to the parent step.
❖Step Over (Ctrl+F11): Steps over descendant steps.
❖Run to Cursor: Stops at the action currently selected by the cursor. (The currently selected action is highlighted in light blue; see screenshot above.) If a breakpoint occurs earlier, processing stops at the breakpoint/s. If the current selection cannot be reached, then processing proceeds to the end stopping only at breakpoints.
❖Toggle Breakpoint (F9): Toggles on/off a breakpoint on the selected action. If MT Debugger is run in Breakpoints Mode, then the simulation will be stopped at the selected action to debug.
The Callstack, Watches, and Variables panes
The three tabs of the lower pane display the results of the debugging. They are described below. At each step of debugging, the results in each tab are updated. You can switch between tabs to check the various results.
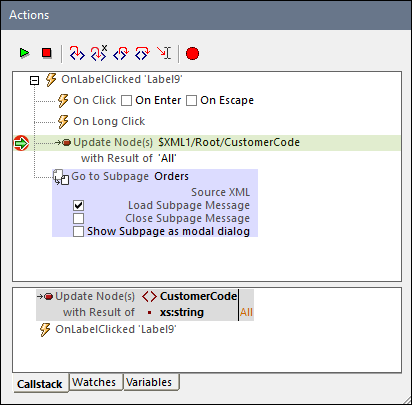
The three screenshots below show the Actions Debugger during a simulation of the SubPages-And-Visibility tutorial. The debugger was in Actions Mode and the first customer, New Fashion, was clicked. This opened the Actions Debugger with the action of the OnLabelClicked control displayed (the label containing the New Fashion text). The action was an action group named Show Orders. On clicking Step Into in the Actions Debugger, we stepped into the Show Orders action group (the actions of which are shown in the screenshots below), and stepped past the first Update Node action. The screenshots were taken on stepping into the second Update Node action. You can open the SubPages-And-Visibility tutorial, and try this out for yourself.
Callstack pane
Displays the actions that are executed and the results of the execution (see screenshot below). The callstack displays the current action, in which the node $XML1/Root/CustomerName has been updated with the text content of the Name element.
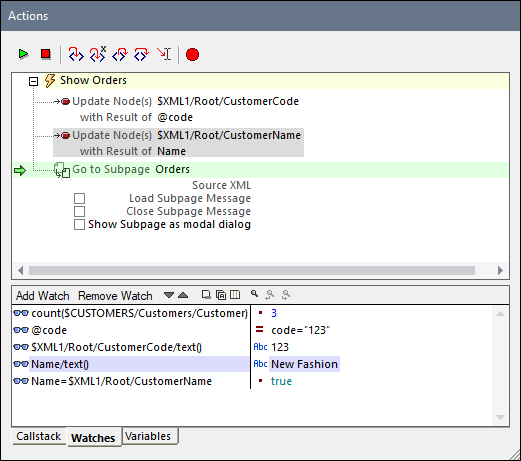
Watches pane
In the Watches pane, you can enter XPath expressions to display data, generate new data (such as, in the example below, the number of customers), and test whether certain conditions are true. Click Add Watch to add a new watch expression, enter the XPath expression, and press Return.
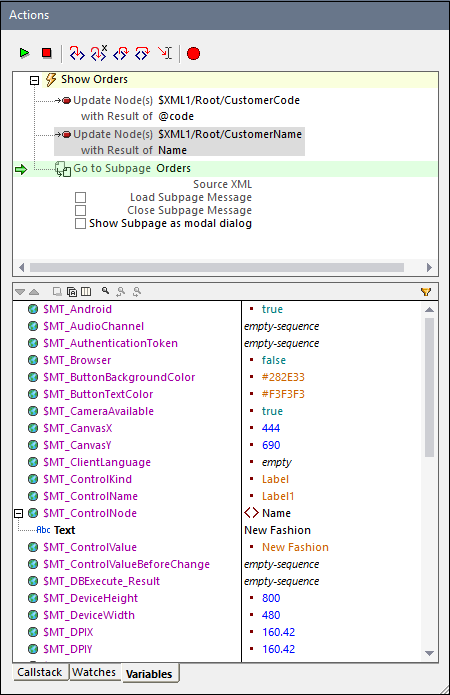
Variables pane
The Variables pane display all the design variables that are currently in scope, including Static Global Variables and Dynamic Local Variables. This information can be very useful for building and debugging expressions defined inside actions.
Closing the Actions Debugger
You can close the Actions Debugger in the following ways:
•Click Stop Debugging.
•Click through the action/s using the Step Into, Step Out Of, and Step Over toolbar buttons till the action/s of the current event have all been executed in the debugger.
•In the Evaluator, toggle off the Actions Mode.