Database-And-Charts
This Database-And-Charts tutorial (DBAndCharts.mtd) shows you how to work with databases (DBs) and charts. It explains how to:
•Set up DB tables as page sources so that DB table data can be displayed and edited
•How to display DB data based on end user choices
•How to create charts that are based on the DB data
The screenshot below shows the first page of the DBAndCharts.mtd solution. The end user can select the office and year for which sales are to be displayed. These selections are made in combo boxes at the top of the design. The total sales for that year are then displayed in the Licenses column of the results table below the combo boxes. Whenever a new office or year is selected in either of the combo box, the results table is automatically updated to reflect the new selection. Additionally, a pie chart showing the sales, by year, for the selected office is displayed. Each slice represents a year, with its sales volume and the percentage of all sales till now that year represents. Whenever a new office is selected, a pie chart showing the statistics of that particular office is displayed.
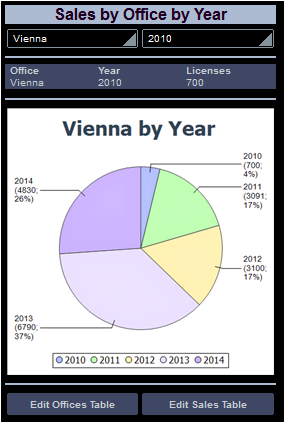
Below the chart are two buttons that each take you to a page in which the relevant DB table data can be edited.
The tutorial files
The files for this tutorial are located in your (My) Documents MobileTogether folder: MobileTogetherDesignerExamples\Tutorials\DBAndCharts.
•The design file is DBAndCharts.mtd. Open it and read the descriptions in the tutorial to see how the design was built and how it works.
•The MS Access database, OfficeSales_DB.mdb, contains the tables used as the page sources of the design.
Video demo of how to create charts
The Altova website provides a video demo that shows how to create charts in your solution.