XSLT and XQuery Profiler
Altova website:  XSLT Profiler, XQuery Profiler
The XSLT/XQuery Profiler is a tool that is used to analyze the execution times of XSLT (1.0 and 2.0) stylesheets and XQuery documents from within XMLSpy. It tells you how much time each instruction in the XSLT stylesheet or XQuery document takes to execute, and you can use this information to optimize the execution time of these files.
The Profiler is used to find the instructions that have the highest total execution time so that this information can then be used to optimize these instructions. Instructions can have a high total execution time for one or both of the following reasons:
•the instruction is time-intensive
•the instruction is evaluated often (high hit count)
Hitcount and Callgraph Profiling
The Profiler lets you choose between hitcount and callgraph profiling. Both types of profiling show execution time statistics for each instruction.
For optimization purposes, you normally use hitcount profiling, which displays one line in the profiler for each instruction.
Callgraph profiling shows the entire execution history of an XSLT transformation or XQuery execution, i.e., which templates/functions were called, and in which order, during the transformation. In the results of callgraph profiling, there is one line for each time an instruction is called, rather than one line for each instruction.
To use the XSLT/XQuery Profiler, see XSLT Profiling or XQuery Profiling.
Profiler Views
The results of the analysis can be viewed in either of the following views by clicking the corresponding tab:
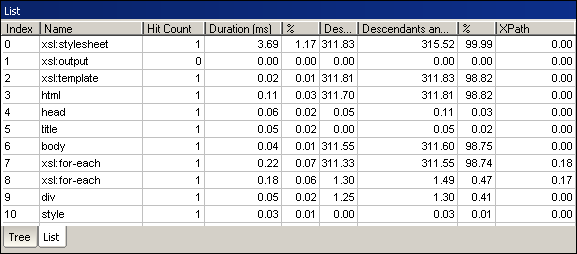
•List View: The profiling statistics are displayed as a list that can be sorted by, e.g., duration of instruction execution or duration of execution of the instruction and its descendants.
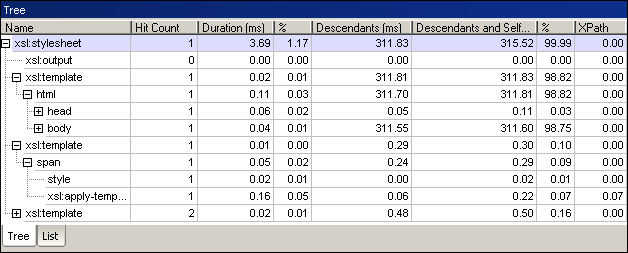
•Tree View: The statistics are displayed in a tree-like structure. It is possible to see, e.g., how long a function took to execute, and then expand the tree for that function and see how much time each instruction in the function took to execute, and how many times it was executed.
Sorting Results
After you have run the Profiler, you can sort by the amount of time an instruction took to execute, or by the number of times that instruction was called.
To sort information in the Profiler:
| 1. | Click the List tab. |
| 2. | Click the column header of the column you want to sort by (e.g., Hit Count to sort by the number of times an instruction was called or Duration to sort by the time the instruction takes to execute). |
This screenshot shows the contents of the Profiler sorted by instruction duration in descending order.
Optimizing Your XSLT Stylesheets and XQuery Documents
Keep in mind the following guidelines when optimizing the execution time of instructions in XSLT stylesheets and XQuery documents:
•Avoid using variables in an instruction if the variable is used only once, because initializing a variable can be time-consuming.
| The following XSLT code fragments show an example of how to optimize code by removing unnecessary variables. Both do the same thing, but the second example does so without using the variables name and containsResult: |
| Code fragment 1: |
<xsl:for-each select="row">
<xsl:variable name="row" select="."/>
<xsl:for-each select="@name">
<xsl:variable name="name" select="."/>
<xsl:variable name="containsResult" select="fn:contains($name, '.exe')"/>
<xsl:if test="string($containsResult)='true'">
...
</xsl:if>
</xsl:for-each>
</xsl:for-each>
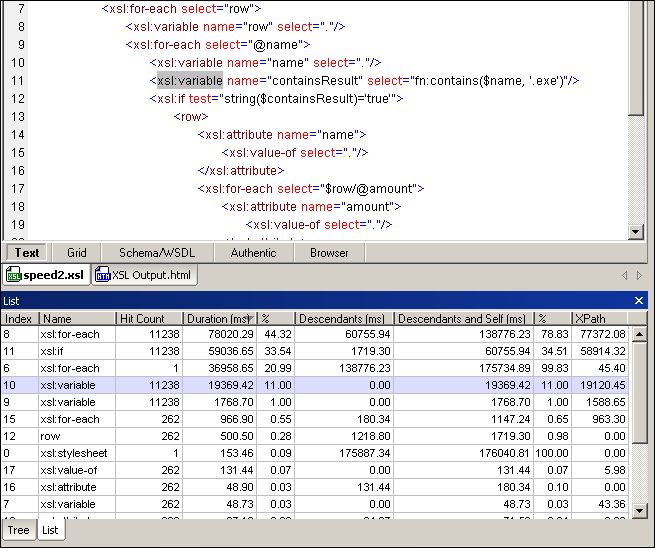
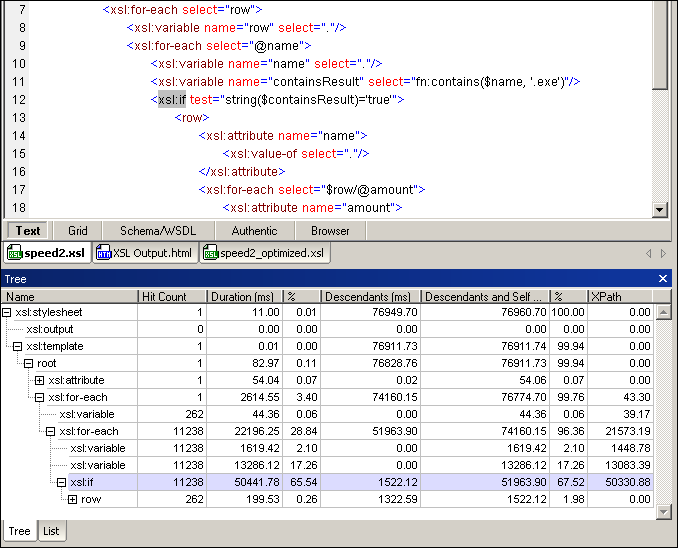
The screenshot below shows the results of the analysis of the file that contains this code fragment, sorted by duration of instructions. The instruction in which the variable containsResult is initialized needs about 19 seconds total execution time.
The screenshot below shows the results in the tree view. Here we can see that the if-statement that uses the variable containsResult needs about 50 seconds total execution time:
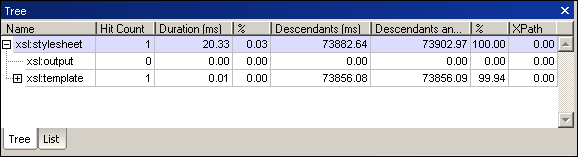
The XSLT tranformation takes a total of about 74 seconds:
| Code fragment 2: |
<xsl:for-each select="row">
<xsl:variable name="row" select="."/>
<xsl:for-each select="@name">
<xsl:if test="fn:contains(., '.exe')">
...
</xsl:if>
</xsl:for-each>
</xsl:for-each>
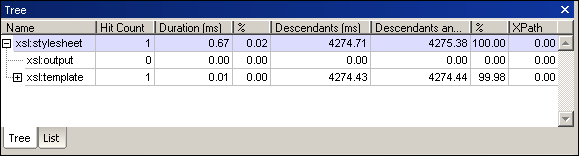
After the stylesheet is rewritten without using these variables, its total execution time is only about 4.3 seconds:
•Use variables if a value or expression is used repeatedly.
•Avoid creating local constant variables within a function; create global variables instead.
•Avoid creating constant tree fragments inside a function; create them globally instead.
•Limit your use of predicates, since filtering with predicates is evaluated separately for every node. You can reduce the number of calls to predicates, for example, by prefiltering using names. In this example, * is used with two predicates:
//*[node-name()=Book][author="Steve"]
| In this equivalent statement, the name Book and only one predicate are used: |
//Book[@Author="Steve"]
•Split up instructions such that parts of the instruction that only need to be executed once are only executed once. Create global variables from parts that are only dependent on the global context.