Chart Data
Clicking the Select Data button pops up the Select Data dialog (screenshot below), which consists of three panes: (i) the Series pane, (ii) the Axis Values pane, and (iii) the chart data table. Each of these is described below.
The Select Columns button pops up the Select Columns dialog, in which you can change the Source XPath and modify the data selection for the X-Axis and Y-Axis.
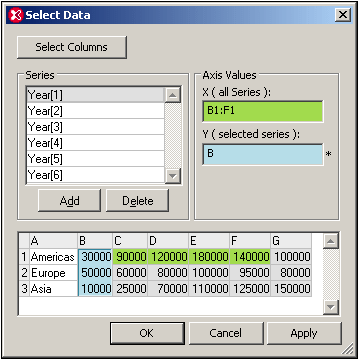
Series pane
The series contained originally in the Series pane are those that were selected in the Select Columns dialog. The series present in this pane when you click OK will be the series that appear in the chart. In the Series pane you can carry out three operations:
•Add and delete series: This enables you to control the number of series appearing in the chart.
•Edit series names: The names of series are the legends that appear in the chart.
•Select data for individual series: With a series selected in the Series pane, the X-Axis and Y-Axis data can be specified in the Axis Values pane. How to do this is described below.
Axis Values pane
The X-Axis and Y-Axis data can be specified in the respective text boxes in the Axis Values pane. When you click in either text box, the value in it can be edited; this is indicated by an asterisk to the right of the text box. The data can be selected as a range from the chart data table, a range being either (i) an entire column or row, or (ii) part of a column or a row. Alternatively, the data can be entered via the keyboard (for example, A or 3 or B1:F1). To mark a range, select the first cell in the range and drag the cursor to the last cell in the range. To mark an entire column or row, select the column or row header, respectively.
The X-Axis selection determines the labels of the X-Axis nodes and applies to all series. It does not change the number of X-Axis ticks.
The Y-Axis selection determines which range of cells is to be used for the selected series. If the number of cells selected is less than the number of X-Axis ticks, then this series will be unrepresented for the latter X-Axis ticks. If the number of cells selected exceeds the number of X-Axis ticks, then additional ticks will be created. The extra ticks will be equal to the number of extra selected cells. The extra values will be represented for this series on the extra number of ticks.
Chart data table
The structure of the chart data table (at the bottom of the Select Data dialog) is obtained from the selections in the Select Columns dialog.
•The number of rows in the table is equal to the number of items in the sequence returned by the Source XPath.
•The columns are named starting from A. The purpose of this naming is to enable selection in the Axis Values pane (for example B1:F1).
•The first column is obtained by evaluating the X-Axis selection in the Select Columns dialog in the context of nodes returned by the Source XPath expression.
•All other columns except the first are obtained by evaluating the Y-Axis selections in the Select Columns dialog. Each series in the Y-Axis selection of the Select Columns dialog corresponds to a column in the chart data table.
The chart data table can be viewed as a superset of data that is selected using the parameters in the Select Columns dialog. From this superset, you can then select ranges of data you require (in the Axis Values pane) for individual series.