X-Axis Selection
The X-Axis selection is specified in the Select Columns dialog (screenshot below). This selection determines the labels that appear on the X-Axis. The labels can subsequently be edited in the Select Data dialog (see below).
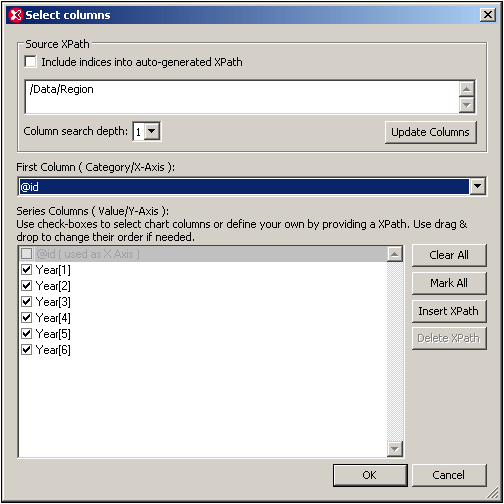
Consider the following XML document example. (It is named YearlySales.xml and is available in the folder C:\Documents and Settings\<username>\My Documents\Altova\XMLSpy2026\Examples\Tutorial.) The cursor is placed in the start tag of the first Region element and the New Chart button of the Charts output window is clicked. The Select Columns dialog appears, with the Source XPath: /Data/Region (see screenshot above).
<?xml version="1.0" encoding="UTF-8"?>
<Data xmlns:xsi="http://www.w3.org/2001/XMLSchema-instance"
xsi:noNamespaceSchemaLocation="YearlySales.xsd">
<Region id="Americas">
<Year id="2005">30000</Year>
<Year id="2006">90000</Year>
<Year id="2007">120000</Year>
<Year id="2008">180000</Year>
<Year id="2009">140000</Year>
<Year id="2010">100000</Year>
</Region>
<Region id="Europe">
<Year id="2005">50000</Year>
<Year id="2006">60000</Year>
<Year id="2007">80000</Year>
<Year id="2008">100000</Year>
<Year id="2009">95000</Year>
<Year id="2010">80000</Year>
</Region>
<Region id="Asia">
<Year id="2005">10000</Year>
<Year id="2006">25000</Year>
<Year id="2007">70000</Year>
<Year id="2008">110000</Year>
<Year id="2009">125000</Year>
<Year id="2010">150000</Year>
</Region>
</Data>
As explained in the Source XPath section, this Source XPath sets up a chart with three ticks on the X-Axis (because the Source XPath returns three items: the three Region elements). Since we want the labels of these three ticks in the chart to be the names of the three regions, we select the @id attribute in the combo box of the X-Axis selection (see screenshot of Select Columns dialog above).
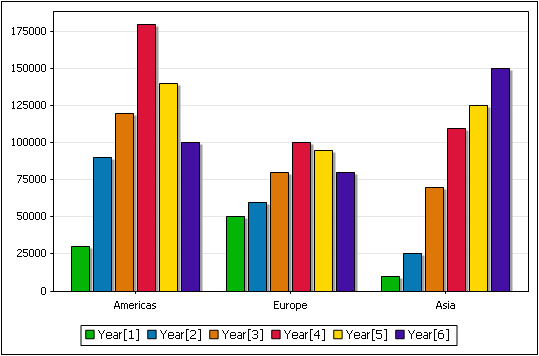
To produce the chart data for each tick, each Region element is evaluated in turn. For each Region element, the id attribute generates the correct label for the X-Axis tick. The X-Axis would look something like in the screenshot below.
If another XPath expression is selected in the X-Axis combo box, then that expression is evaluated within the respective Region element context and the evaluated result will be the label of the respective tick. The Auto-Enumerated option generates a number sequence that corresponds to the tick number: the first tick will be numbered 1, the second 2, and so on.
Modifying the X-Axis labels and the number of X-Axis ticks
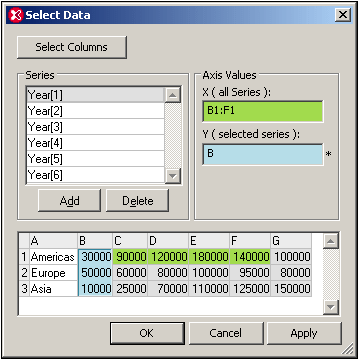
The selection of labels for the X-Axis can be modified in the Select Data dialog (accessed by clicking the Select Data button of the Charts output window).
In the Select Data dialog shown in the screenshot below, for example, click in the X-Axis text box of the Axis Values pane. This enables the X-Axis selection to be modified. Now click the B1 field and drag the mouse to F1 to make the B1:F1 selection. Click OK to see the new chart.
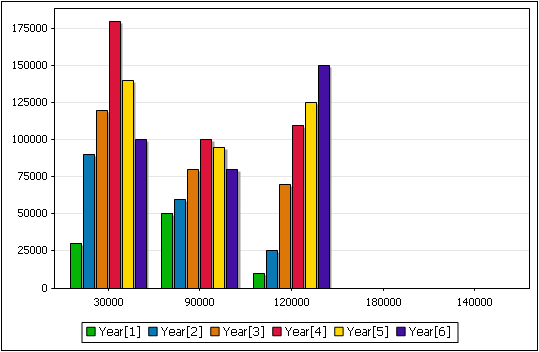
This selection will now provide the labels for the ticks, as shown in the screenshot below. Notice also that since the new selection contains five items, five ticks have been generated. However, only the first three are populated. This is because the Source XPath returns three nodes and these are the nodes that will be processed for the charts. These three nodes correspond to the rows of the table shown in the Select Data dialog. Note that the number of rows in the table can only be modified by changing the Source XPath.
For more information about how the Source XPath and X-Axis selections interact, see How Chart Data Is Created.