Debugging
In our example, we use:
•DebuggerClient.htm as the SOAP-request entry-point, and
•the WSDL file http://www.nanonull.com/TimeService/TimeService.asmx?WSDL that was selected when the SOAP Debugger was started.
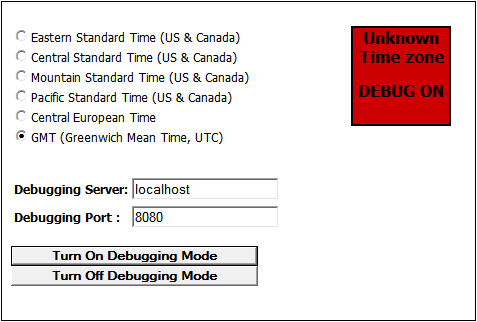
After setting breakpoints, click the GO icon  (or use the menu command SOAP | GO). Then click the DebuggerClient.htm tab to switch to the SOAP entry-point file. Make sure that the GMT option is selected, and click the Turn On Debugging Mode button (see screenshot below). This displays a Debug On message, and sends the SOAP request to the SOAP Debugger. Debugger results are displayed in the SOAP Request and SOAP Response windows, and are described in the next section, Analyzing Debugger Results for Errors.
SOAP Debugger controls
The SOAP Debugger toolbar (screenshot below) contains icons to operate the SOAP Debugger.
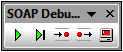
These icons are, from left:
•Go: Starts debugging.
•Single Step: Steps through the Request-Response process, stopping at breakpoints.
•Break on Next Request: Stops at next SOAP Request.
•Break on Next Response: Stops at next response from the Web service.
•Stop the Proxy Server: Stops debugging. Note that this is not the same as ending the SOAP Debugger session. To end/start the SOAP Debugger session, select the menu command SOAP | SOAP Debugger Session.