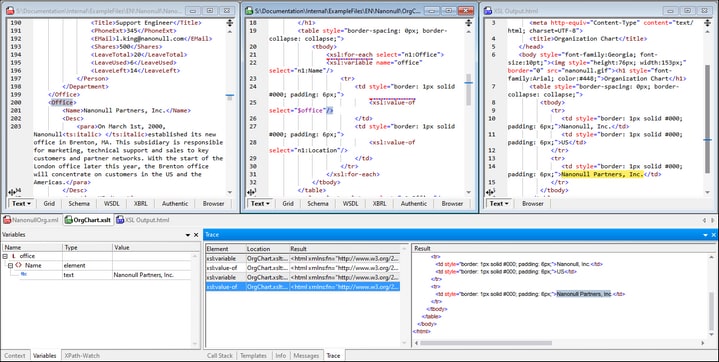
Trace Window
The Trace Window (see screenshot below) shows information about the tracepoints that have been set in the relevant documents (XML/JSON and XSLT/XQuery). If you click the XSL/XQuery | Start Debugger command, then all tracepoints in the relevant documents are evaluated and are listed in the Trace Window. If, however, you step through the debugging process, then tracepoints are listed as they are encountered.
The Trace Window is divided into two panes:
•The main pane on the left has lists the nodes on which the tracepoint has been set, together with the name of the file containing the node and the result returned by the processing/execution at the tracepoint.
•The right pane, which shows the evaluation result of a tracepoint that is selected in the left pane.
For a more detailed discussion, see the topic Tracepoints.
