Setting Breakpoints
Before you start debugging, you must set breakpoints in the SOAP Debugger. When debugging starts, the SOAP Debugger will show the requests and responses at breakpoints it encounters.
The SOAP Debugger lists breakpoints (in its Function-Breakpoints and Conditional-Breakpoints panes) according to information obtained from the WSDL file that was selected at the time the SOAP Debugger was started. These breakpoints relate to SOAP requests that can be generated by the WSDL file. For each SOAP request, a breakpoint on request and on response can be selected by checking the check boxes in the respective columns (see screenshot below).
In our example, we use:
•DebuggerClient.htm as the SOAP-request entry-point, and
•the WSDL file http://www.nanonull.com/TimeService/TimeService.asmx?WSDL that was selected when the SOAP Debugger was started.
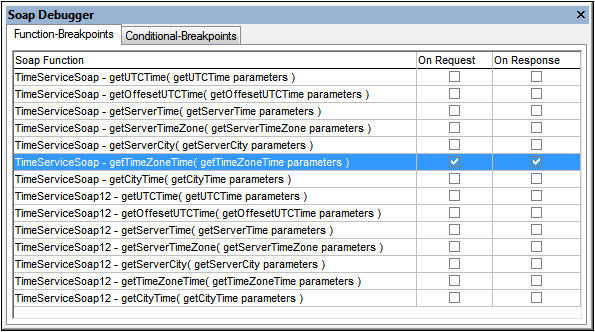
The Web service requested by DebuggerClient.htm uses the method getTimeZoneTime to find the time in the selected timezone. In the SOAP Debugger, SOAP requests that can be generated from the selected WSDL file are listed as breakpoinrts. We set breakpoints at getTimeZoneTime for both On Request and On Response (see screenshot below). This enables you to analyze both SOAP requests and Web service responses for errors.
For more detailed information about setting breakpoints, see the section, More About Breakpoints.