General
The General section of the Change Appearance dialog box lets you define the title and subtitle of the chart, add or remove a legend, and define background pictures and colors and—for bar, line, area, and candlestick charts—orientation of the chart.
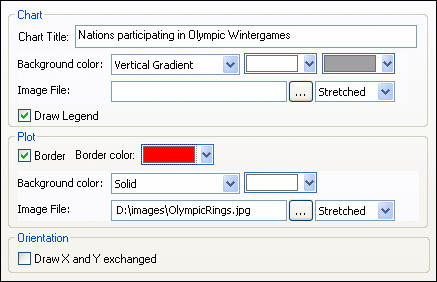
Chart
Enter a descriptive title for your chart into the Chart Title field, the Chart Sub Title field, and select a background color for the entire chart from the drop-down list. You can choose a solid background, vertical gradient, or horizontal gradient and define start and end colors for the gradient, if applicable. In addition, or instead of a colored background, you can also define a background image and choose one of the available display options from the drop-down list:
•Stretched: the image will be stretched to the height and width of the chart
•Zoom to Fit: the image will be fit into the frame of the chart and the aspect ratio of the image will be maintained
•Center: the image will be displayed in its original size in the center of the chart
•Tiled: if the image is smaller than the chart, duplicates of the image will be displayed to fill the background area
The Draw Legend check box is activated by default, clear the check box if you do not want to display a legend in your chart.
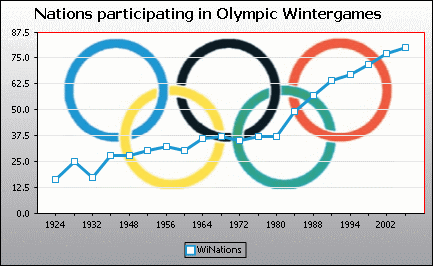
Plot
The Plot is the area where the actual data of the chart is displayed. You can draw a border around the plot and specify a different background color and/or image for the plot area. In the screenshot below, the background color of the chart has been changed to gray (vertical gradient) whereas the plot is still white, a red border has been drawn around it, and a background image has been added.
Orientation
If you have a small series of large values it may be convenient to swap the X and Y axis for a better illustration. Note that in the screenshot below also the background color of the plot has been set to "Transparent" and the background image has been applied to the chart.
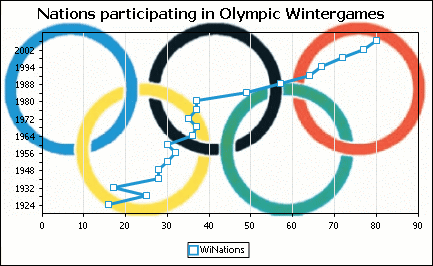
Note that this option is not available for pie and gauge charts.