SOAP-Request Entry-Point
An HTML file in the Examples project (DebuggerClient.htm) contains a script that shows how the SOAP Debugger can be used. This file enables the user to send a SOAP request to a Web service and then displays the response from the Web service. You can open this file in XMLSpy as follows:
1.Select the menu command Project | Open Project.
2.Browse to the C:\Documents and Settings\<username>\My Documents\Altova\XMLSpy2026\Examples folder and select the Examples.spp file.This loads the Examples project in the Project window (screenshot below).
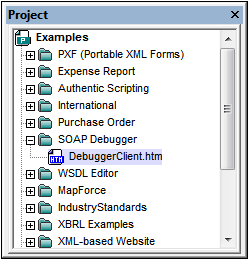
3.Click the + sign of the SOAP Debugger folder to see its contents. Double-click DebuggerClient.htm to open the file in XMLSpy.
Note: Alternatively, you can open this file (DebuggerClient.htm) via the File | Open menu command. The file is located in the C:\Documents and Settings\<username>\My Documents\Altova\XMLSpy2026\Examples folder.
The sample file
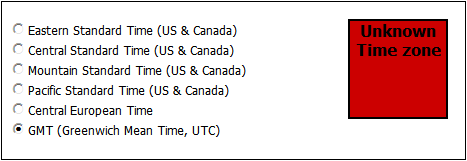
The file DebuggerClient.htm will look something like this in the Browser View of XMLSpy. When one of the radio buttons is selected, a SOAP request is sent to the Nanonull Time Web Service. The response from the Web service is displayed in the colored box to the right of the radio buttons.

Notice that the response to an Eastern Standard Time request is displayed (6:23) in a blue "clock box" in the screenshot above. Now select the GMT radio button. Instead of the GMT value being displayed in the clock box (the Web service response box), an error message is displayed and the clock box turns red (see screenshot below).
The SOAP Debugger can now be used to analyse SOAP messages to locate the error. The following three sections discuss, respectively, (i) how to set breakpoints, (ii) how to run the SOAP Debugger with DebuggerClient.htm, and (iii) how to analyse the SOAP Debugger output in order to locate errors.