Output Window: Charts
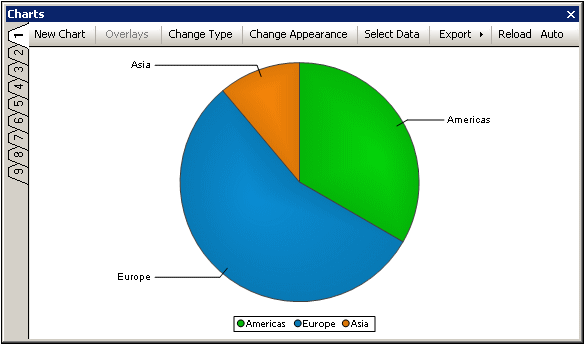
When an XML document is open in Text View or Grid View, a chart (pie chart, bar chart, etc) representing selected data in the XML document can be generated in the Charts Window (screenshot below).
Creating the chart
The broad steps for creating a chart are as follows:
1.Place the cursor in the XML document to select a context node.
2.Click the New Chart button in the Charts Window (see screenshot above) or right-click in the Main Window and select New Chart from the context menu.
3.In the Select Columns dialog that pops up, select data for the chart data table and click OK. The chart will be created in the Charts Window (screenshot above).
Note: The output window has nine tabs. You can, therefore, keep an output in one tab and get a new output in another tab.
For detailed information, see the section Charts in the XML section of the user manual.
Modifying and managing charts
A chart can be created in any of the nine Charts Window tabs (numbered along the left side of the window). In this way charts in different tabs can be compared. A chart created in a tab can only be overwritten when a new chart is created in that tab. A chart cannot be otherwise deleted. Even when the XML document that was used to generate a chart is closed, the chart remains in the tab in which it was created.
The buttons at the top of the window do the following:
•New Chart: Pops up the Select Columns dialog, in which the chart data table is configured.
•Overlays: Enables you to add and delete layers over the main chart. After creating a new layer, you can add a new chart to this layer by clicking the New Layer tab and specifying the data to be used in this overlay chart.
•Change Type: Enables the chart type to be changed, for example, from a bar chart to a pie chart.
•Change Appearance: Enables settings, like the chart's fonts sizes and color schemes, to be changed.
•Select Data: Pops up the Select Data dialog, which contains the chart data table and the final selection of data that will be presented in the chart. Data for the series, the X-Axis and Y-Axis can be modified in this dialog. The X-Axis and Y-Axis data can be graphically selected from the chart data table. Clicking OK generates the modified chart in the Charts Window.
•Export: the chart can be exported as an image file, or as an XSLT or XQuery fragment to the clipboard. The XSLT or XQuery fragment can be used in an XSLT or XQuery document, which when processed with the Altova XSLT 2.0 Engine or the Altova XQuery Engine, will correctly render the chart.
•Reload/Auto: If the Auto button is toggled on, then any change in the underlying XML document will automatically refresh a chart in the Charts Window that is based on the XML document. Otherwise a chart will only be updated when the Reload button is pressed.
For more information, see the section Charts in the XML section of the user manual.