Charts
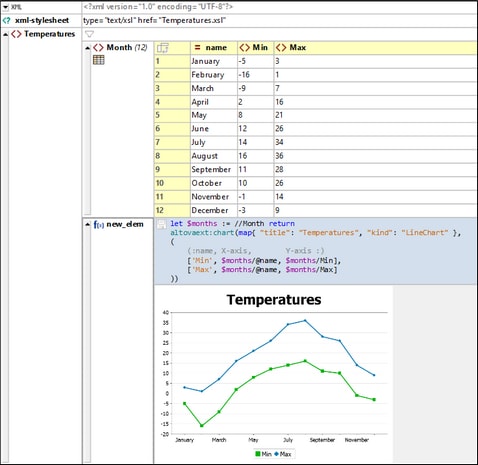
Charts can be created in Grid View by using the Altova XPath/XQuery extension named altovaext:chart (see screenshots below). This extension is described below. It is also described along with other chart extensions in the section Chart Functions.
Chart example in XML
The altovaext:chart extension shown in the screenshot below is used in an XQuery Let expression that is defined inside a Grid View formula. The chart is displayed as an image below the formula. You can use the XML document listing and the XQuery expression given below to try out the charts function.
<?xml version="1.0" encoding="UTF-8"?> <Temperatures> <Month name="January"> <Min>-5</Min> <Max>3</Max> </Month> <Month name="February"> <Min>-16</Min> <Max>1</Max> </Month> <Month name="March"> <Min>-9</Min> <Max>7</Max> </Month> <Month name="April"> <Min>2</Min> <Max>16</Max> </Month> <Month name="May"> <Min>8</Min> <Max>21</Max> </Month> <Month name="June"> <Min>12</Min> <Max>26</Max> </Month> <Month name="July"> <Min>14</Min> <Max>34</Max> </Month> <Month name="August"> <Min>16</Min> <Max>36</Max> </Month> <Month name="September"> <Min>11</Min> <Max>28</Max> </Month> <Month name="October"> <Min>10</Min> <Max>26</Max> </Month> <Month name="November"> <Min>-1</Min> <Max>14</Max> </Month> <Month name="December"> <Min>-3</Min> <Max>9</Max> </Month> </Temperatures>
|
let $months := //Month return altovaext:chart(map{ "title":"Temperatures", "kind":"LineChart" }, ( (:name, X-axis, Y-axis :) ['Min', $months/@name, $months/Min], ['Max', $months/@name, $months/Max] ))
|
Chart example in JSON
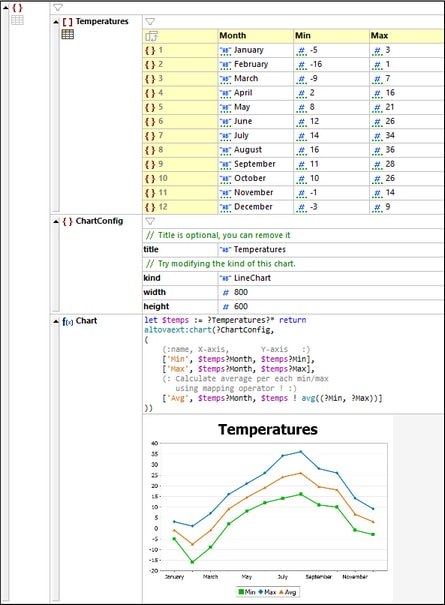
The altovaext:chart extension shown in the screenshot below is used in an XQuery Let expression that is defined inside a Grid View formula. The chart is displayed as an image below the formula. This chart example is in the file Chart.jsonc, which is located in the Examples folder of your (My) Documents folder and also accessible via the Examples project.) The JSON document listing is also given below for your convenience so that you can more easily try out the charts function. The charts function is contained in the JSON document listing, but it is also listed separately below.
// This file demonstrates the new features in JSON Grid View. // Switch to Grid View to enjoy new features like filters and formulas. { "Temperatures": [ { "Month": "January", "Min": -5, "Max": 3 }, { "Month": "February", "Min": -16, "Max": 1 }, { "Month": "March", "Min": -9, "Max": 7 }, { "Month": "April", "Min": 2, "Max": 16 }, { "Month": "May", "Min": 8, "Max": 21 }, { "Month": "June", "Min": 12, "Max": 26 }, { "Month": "July", "Min": 14, "Max": 34 }, { "Month": "August", "Min": 16, "Max": 36 }, { "Month": "September", "Min": 11, "Max": 28 }, { "Month": "October", "Min": 10, "Max": 26 }, { "Month": "November", "Min": -1, "Max": 14 }, { "Month": "December", "Min": -3, "Max": 9 } ], "ChartConfig": { //Title is optional, you can remove it "title": "Temperatures", //Try modifying the kind of this chart. "kind": "LineChart", "width": 800, "height": 600 } /*(:altova_xq:)Chart(:altova_xq_key:) altovaext:chart(?ChartConfig, ( (:name, X-axis, Y-axis :) ['Min', $temps?Month, $temps?Min], ['Max', $temps?Month, $temps?Max], (: Calculate average per each min/max using mapping operator ! :) ['Avg', $temps?Month, $temps ! avg((?Min, ?Max))] ))*/ }
|
let $temps := ?Temperatures?* return altovaext:chart(?ChartConfig, ( (:name, X-axis, Y-axis :) ['Min', $temps?Month, $temps?Min], ['Max', $temps?Month, $temps?Max], (: Calculate average per each min/max using mapping operator ! :) ['Avg', $temps?Month, $temps ! avg((?Min, ?Max))] ))
|
Using the Altova Charts extension
•The charts extension function altovaext:chart must use the namespace prefix altovaext:.
•The function altovaext:chart takes two arguments: (i) chart configuration information, and (ii) chart data series information.
•The chart configuration information is the first argument of altovaext:chart. It is an unordered series of four key–value pairs. These pairs are for (i) the chart's title (key is title), (ii) the kind of chart, such as pie chart, line chart, etc (key is kind; see Chart Functions for available kinds), (iii) chart width in pixels (integers only; key is width), and (iv) chart height in pixels (integers only; key is height). If either, the width or height value, or both values are not given, then the missing value or values are auto-calculated on the basis of the data.
•In the screenshot of the JSON example above, the configuration information is stored in the ChartConfig object, which is referenced in the altovaext:chart function.
•The chart data series is the second argument of altovaext:chart. Each data series is an array of size 3: (i) the name of the series, (ii) the x-axis values, (ii) the y-axis values. If you wish to create multiple series (for example where each series represents a line, as in the example above) then create a sequence of multiple arrays.
•The XML example above has two data series; for the minimum, and maximum temperatures. The data for the X and Y axes are referenced from the sequence of all Month elements.
•The JSON example above has three data series; for the minimum, maximum, and average temperatures. The data for the X and Y axes are referenced from the array named Temperatures.
For more information, see the section Chart Functions.


