Y-Axis Selection
The Y-Axis (see screenshot below) is also known as the Series Axis.
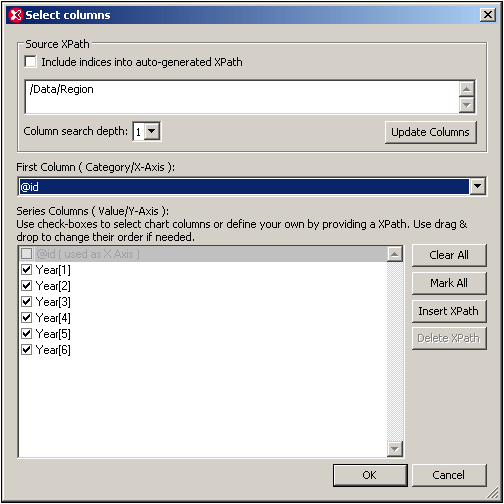
The selection you make for this axis determines how many series are plotted for each X-Axis tick. If only one series is selected, then at each X-Axis tick, the value returned by the XPath expression for that series is plotted. If more series are selected, as in the screenshot below, in which six series are selected, then the chart data selection will be as in the table below. (The context node for the Y-Axis data selection is the respective Region element.)
Source XPath | X-Axis | Y-Axis (Series columns) | |||||
Region[1] | @id | Year[1] | Year[2] | Year[3] | Year[4] | Year[5] | Year[6] |
Region[2] | @id | Year[1] | Year[2] | Year[3] | Year[4] | Year[5] | Year[6] |
Region[3] | @id | Year[1] | Year[2] | Year[3] | Year[4] | Year[5] | Year[6] |
The resulting chart will look something like this:
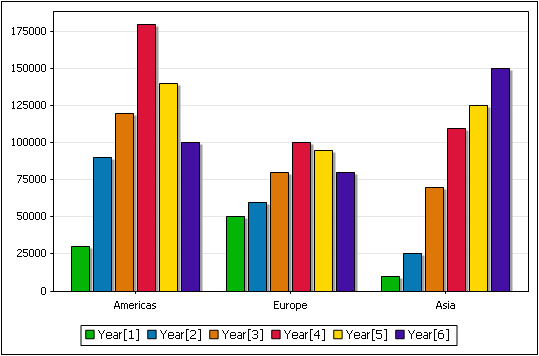
There are three X-Axis ticks, labeled with the value of the respective Region/@id attributes. At each X-Axis tick, the XPath expression for each series is evaluated. In our example, for each X-Axis tick, each of the six series is evaluated and plotted. For example, the first series (Year[1]) is plotted for all three regions, so also Year[2] to Year[6].
Note: Some charts, such as pie charts and single-bar charts, take only one axis. In a single-bar chart for example, each X-Axis tick will have just a single bar: that representing the single series. In a pie chart, the values of the single series will sum up to 100% of the pie, with each value being assigned to one X-Axis tick.
Y-Axis legends
The legends that appear below the chart are the names of the series. These names can be modified in the Select Data dialog.
Switching the X-Axis and Y-Axis selections
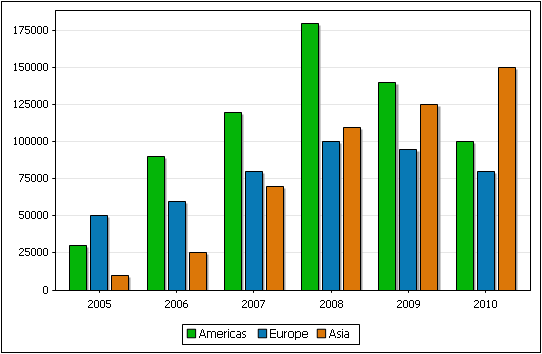
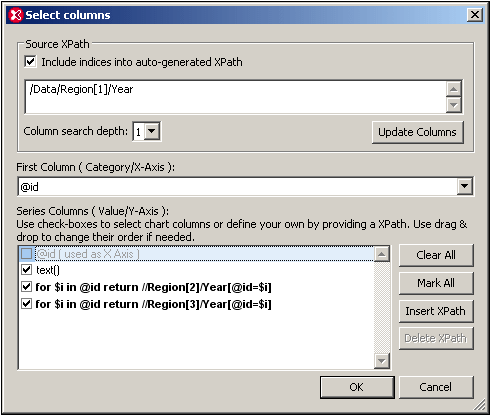
In the example above, the regions are on the X-Axis and the yearly sales are plotted on the Y-Axis for each region; the Year elements are the series. But what if we wished to plot the years on the X-Axis and compare the regional sales for each year as in the bar chart below? We would need six X-Axis ticks (obtained via the Source XPath selection), then to label the X-Axis ticks with the respective years, and finally to select three series (for the regions), all of which will be represented at each X-Axis tick. The screenshot below, of the Select Columns dialog, shows how this data selection might be achieved.
Selecting the series
To make a node a series for the chart, check that node's check box. You can modify the Source XPath and the Column Search Depth to make the required node available in the Series pane. Alternatively, you can add an XPath expression to select a node, as in the screenshot below. See Chart Example: Advanced for a description of this scenario.
Reference
The XML document used for the example in this section is given here for reference. It is named YearlySales.xml and is available in the folder C:\Documents and Settings\<username>\My Documents\Altova\XMLSpy2026\Examples\Tutorial.
<?xml version="1.0" encoding="UTF-8"?>
<Data xmlns:xsi="http://www.w3.org/2001/XMLSchema-instance"
xsi:noNamespaceSchemaLocation="YearlySales.xsd">
<Region id="Americas">
<Year id="2005">30000</Year>
<Year id="2006">90000</Year>
<Year id="2007">120000</Year>
<Year id="2008">180000</Year>
<Year id="2009">140000</Year>
<Year id="2010">100000</Year>
</Region>
<Region id="Europe">
<Year id="2005">50000</Year>
<Year id="2006">60000</Year>
<Year id="2007">80000</Year>
<Year id="2008">100000</Year>
<Year id="2009">95000</Year>
<Year id="2010">80000</Year>
</Region>
<Region id="Asia">
<Year id="2005">10000</Year>
<Year id="2006">25000</Year>
<Year id="2007">70000</Year>
<Year id="2008">110000</Year>
<Year id="2009">125000</Year>
<Year id="2010">150000</Year>
</Region>
</Data>