Chart Example: Simple
Consider the following XML document. (It is named YearlySales.xml and is available in the folder C:\Documents and Settings\<username>\My Documents\Altova\XMLSpy2026\Examples\Tutorial.)
<?xml version="1.0" encoding="UTF-8"?>
<Data xmlns:xsi="http://www.w3.org/2001/XMLSchema-instance"
xsi:noNamespaceSchemaLocation="YearlySales.xsd">
<Region id="Americas">
<Year id="2005">30000</Year>
<Year id="2006">90000</Year>
<Year id="2007">120000</Year>
<Year id="2008">180000</Year>
<Year id="2009">140000</Year>
<Year id="2010">100000</Year>
</Region>
<Region id="Europe">
<Year id="2005">50000</Year>
<Year id="2006">60000</Year>
<Year id="2007">80000</Year>
<Year id="2008">100000</Year>
<Year id="2009">95000</Year>
<Year id="2010">80000</Year>
</Region>
<Region id="Asia">
<Year id="2005">10000</Year>
<Year id="2006">25000</Year>
<Year id="2007">70000</Year>
<Year id="2008">110000</Year>
<Year id="2009">125000</Year>
<Year id="2010">150000</Year>
</Region>
</Data>
We wish to produce a chart that plots the three regions on the X-Axis and gives the yearly sales for each region. Our chart should look something like the bar chart below.
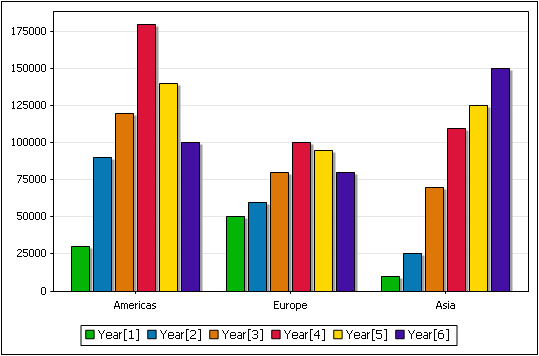
This is a simple chart to create because we can select the Region element as the Source XPath. The Source XPath expression returns a sequence of three items: the three Region elements. Each Region element will, in turn, be the context node for the X-Axis and Y-Axis data selections.
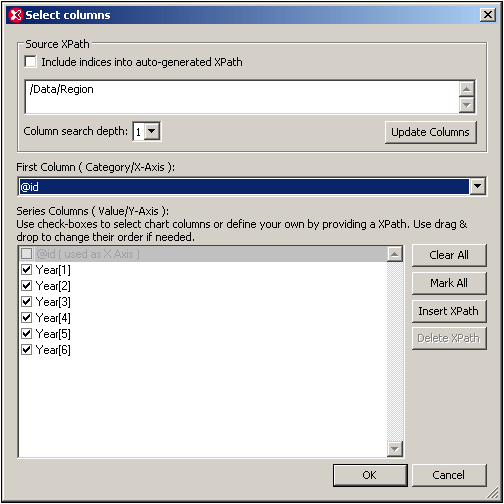
For the series we want the Year elements of each region, so a search depth of one level will suffice. We select the Region element's id attribute for the X-Axis. The id attribute values will therefore be used as the labels of the three X-Axis ticks. All the Year series are checked because we wish to include all the Year elements in the chart data table.
Clicking the OK button generates the chart we wanted. For more advanced charts, see the section, Chart Example: Advanced.