XQuery Profiling
Starting the Profiler
Note that execution time results displayed in the Profiler may be influenced by other applications that are running on your computer. When analyzing files using the Profiler, it is best to run only the XMLSpy application.
To analyze an XQuery document:
| 1. | In XMLSpy, open the XQuery document that you want to analyze. |
| 2. | Activate the Profiler by selecting XSL/XQuery | Enable XSLT 2 / XQuery profiling. A dialog opens. |
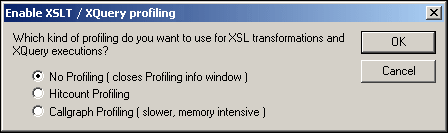
| 3. | Select Hitcount Profiling or Callgraph Profiling. Click OK to confirm. An empty Profiler window appears. |
| 4. | Execute the XQuery (XSL/XQuery | XQuery Execution). When execution is finished, the execution time statistics appear in the Profiler. |
| 5. | Click the "+" icons to expand rows in the Profiler to view the execution time statistics for the instructions in the XQuery document (see screenshot). Note that in the case of these screenshots, Hitcount Profiling was selected. |
Click on a row in the Profiler to highlight the corresponding instruction in the file that was analyzed.
The following screenshot shows the Tree View in the Profiler:

The following screenshot shows List View in the Profiler for the same XQuery document:

Using the Information in the Profiler
The Profiler displays the following information about each instruction in the XQuery document:
•Index: A number assigned to each instruction in the order in which the instruction was called.
•Name: The name of the XQuery instruction.
•Info: Information about the instruction. For example, if the instruction is a variable declaration, this column contains the name of the variable and its value; if it is a function, then this contains the name and parameters of the function.
•Hit Count: The total number of times the instruction was called during execution.
•Duration (ms) and %: The number of milliseconds that the instruction took to execute without taking the execution time of its descendants into account, and the percentage of the total execution time.
•Descendants and Self (ms) and %: The total time spent executing the instruction and its descendants, and the percentage of the total execution time.
Note: When using hitcount profiling, the times in the Profiler window are the sum total of execution time for all the hits to the instruction. When using callgraph profiling, because each call of the instruction is listed separately, the times shown in the Profiler window are the duration of a single execution of the instruction.