3D Angles
In 3d bar charts you can customize the 3d appearance of the chart in the 3d Angles section of the Change Appearance dialog box.
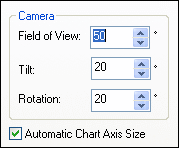
The Field of view option causes the diagram to appear as if observed from a small or great distance. Values ranging from 1 through 120 are valid. Higher values cause the diagram to appear as if observed from a greater distance.
The Tilt value determines the rotation around the X-axis, whereas the Rotation value defines the rotation around the Y-axis. You can automatically adapt the size of the chart axis to the Chart window width by selecting the corresponding check box.
If the Automatic Chart Axis Size check box is selected, XMLSpy will automatically calculate the optimum size of the X-axis as well as the Y-axis for the current Chart window size. The width and height of the chart will change dynamically when you resize the Chart window.