Creating a Chart
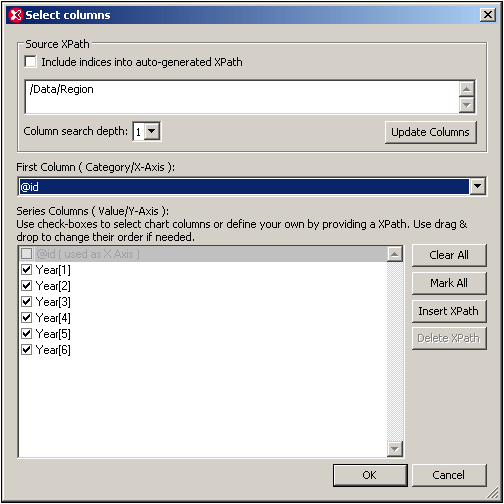
The New Chart button pops up the Select Columns dialog (screenshot below), in which three fundamental data selection parameters for the chart are specified. These parameters (listed below) are used to build up the chart data table.
•Source XPath: An XPath expression is automatically entered when the dialog opens. It selects the node in the XML document that was selected when the Select Columns dialog was accessed. It can be edited in the dialog using the keyboard. The Include Indices checkbox determines whether predicate filters in the XPath will be used or not (see Source XPath for details). Descendant nodes of the node/s selected by the Source XPath will be available for selection as X-Axis and Y-Axis data columns. The Column Search Depth combo box determines how many descendant levels will be searched to return nodes that may be used for X-Axis and Y-Axis data selection. After the Source XPath has been edited, Update Columns must be clicked for the change to take effect and for the X-Axis and Y-Axis lists in the dialog to be refreshed.
•X-Axis: The selection in this combo box specifies which node will be used as the X-Axis. The sequence returned for this selection will give the labels that occur on the X-Axis. The Auto-Enumerated option of the combo box provides numbered labels for the X-Axis. Note that XPath expressions created for the Y-Axis are also available for selection in the X-Axis combo box.
•Y-Axis: The entries that are checked in this pane will be the nodes, the numeric values of which will be represented on the numeric Y-Axis. The Clear All and Mark All buttons deselect all items and select all items in the Y-Axis pane, respectively. The Insert XPath button enables a series to be generated that is not available because it is not a descendant of the node the Source XPath returns. The node or XPath expression selected for the X-Axis is not available for Y-Axis selection and is grayed out.
How the chart data table is created
The data that is used for the chart is determined by the selection made in the Select Columns dialog. We will explain how the chart data is selected with the help of an example. Since the XML document (see screenshot further below) contains three Region elements, the Source XPath /Data/Region selects each of them in turn. With each Region element as the context node, the columns of data are then generated. For each Region element selected because of the Source XPath the following is done:
1.The X-Axis expression generates the first column (by default this column will be the column used for the X-Axis labels).
2.For each series (Y-Axis selections) a column is generated.
The chart data generated for the Select Columns dialog shown above can be visualized as in the following table.
Source XPath | X-Axis | Y-Axis (Series columns) | |||||
Region[1] | @id | Year[1] | Year[2] | Year[3] | Year[4] | Year[5] | Year[6] |
Region[2] | @id | Year[1] | Year[2] | Year[3] | Year[4] | Year[5] | Year[6] |
Region[3] | @id | Year[1] | Year[2] | Year[3] | Year[4] | Year[5] | Year[6] |
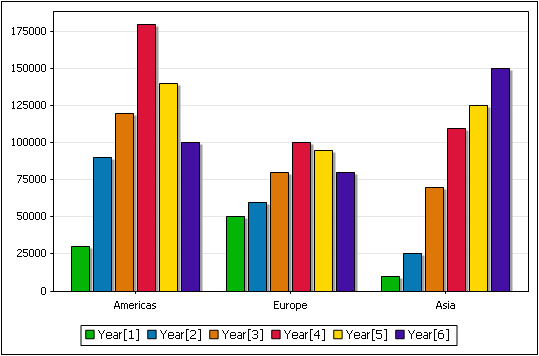
A bar chart generated from this data would look something like this:
The following important points should be noted:
•The number of ticks on the X-Axis is determined by the size of the sequence returned by the Source XPath expression (in this case three).
•The nodes returned by the Source XPath will be the context nodes, respectively, for generating two sets of data for each tick on the X-Axis: (i) the X-Axis tick label (made with the X-Axis selection), and (ii) all the series to be plotted for that tick (these series are selected with the Y-Axis selection). The XPath expressions entered for the X-Axis and Y-Axis will be evaluated as XPath expressions in the context of these (Source XPath) nodes.
•The sequence returned by the X-Axis selection will be, respectively, the label for each tick. If there are fewer labels than there are ticks, then some ticks will remain unlabelled.
•Each series (for example Year[1]) is evaluated once for each context node. For some charts, like pie charts or single-bar charts, only one series can be used.
•The legends are obtained from the names of series items.
The XML document used for the example above is given here for reference. It is named YearlySales.xml and is available in the folder C:\Documents and Settings\<username>\My Documents\Altova\XMLSpy2026\Examples\Tutorial.
<?xml version="1.0" encoding="UTF-8"?>
<Data xmlns:xsi="http://www.w3.org/2001/XMLSchema-instance"
xsi:noNamespaceSchemaLocation="YearlySales.xsd">
<Region id="Americas">
<Year id="2005">30000</Year>
<Year id="2006">90000</Year>
<Year id="2007">120000</Year>
<Year id="2008">180000</Year>
<Year id="2009">140000</Year>
<Year id="2010">100000</Year>
</Region>
<Region id="Europe">
<Year id="2005">50000</Year>
<Year id="2006">60000</Year>
<Year id="2007">80000</Year>
<Year id="2008">100000</Year>
<Year id="2009">95000</Year>
<Year id="2010">80000</Year>
</Region>
<Region id="Asia">
<Year id="2005">10000</Year>
<Year id="2006">25000</Year>
<Year id="2007">70000</Year>
<Year id="2008">110000</Year>
<Year id="2009">125000</Year>
<Year id="2010">150000</Year>
</Region>
</Data>
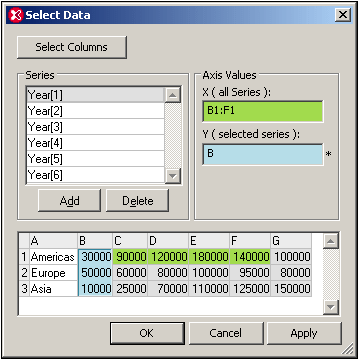
The data selection shown in the Select Columns dialog above can be seen in the table of the Select Data dialog (screenshot below). The Select Data dialog is accessed by clicking the Select Data button in the Charts output window.
For more details about the individual parameters of the Select Columns dialog, see the individual sections: Source XPath, X-Axis Selection, Y-Axis Selection, and Chart Data.