Chart Example: Advanced
Consider the following XML document. (It is named YearlySales.xml and is available in the folder C:\Documents and Settings\<username>\My Documents\Altova\XMLSpy2026\Examples\Tutorial.)
<?xml version="1.0" encoding="UTF-8"?>
<Data xmlns:xsi="http://www.w3.org/2001/XMLSchema-instance"
xsi:noNamespaceSchemaLocation="YearlySales.xsd">
<Region id="Americas">
<Year id="2005">30000</Year>
<Year id="2006">90000</Year>
<Year id="2007">120000</Year>
<Year id="2008">180000</Year>
<Year id="2009">140000</Year>
<Year id="2010">100000</Year>
</Region>
<Region id="Europe">
<Year id="2005">50000</Year>
<Year id="2006">60000</Year>
<Year id="2007">80000</Year>
<Year id="2008">100000</Year>
<Year id="2009">95000</Year>
<Year id="2010">80000</Year>
</Region>
<Region id="Asia">
<Year id="2005">10000</Year>
<Year id="2006">25000</Year>
<Year id="2007">70000</Year>
<Year id="2008">110000</Year>
<Year id="2009">125000</Year>
<Year id="2010">150000</Year>
</Region>
</Data>
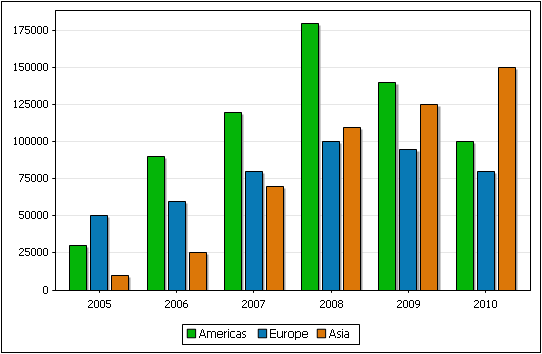
We wish to produce a chart that plots the years on the X-Axis and compare the regional sales for each year. Our chart should look something like the bar chart below.
We show two ways in which this can be done. These two ways together demonstrate how the different data selection parameters can be combined to produce the required results.
Method 1: Modifying Axis Values
In the first method, the axes that were selected in the Select Columns dialog are modified in the Select Data dialog. All that must be ensured is that all the required data is available for selection in the chart data table in the Select Data dialog.
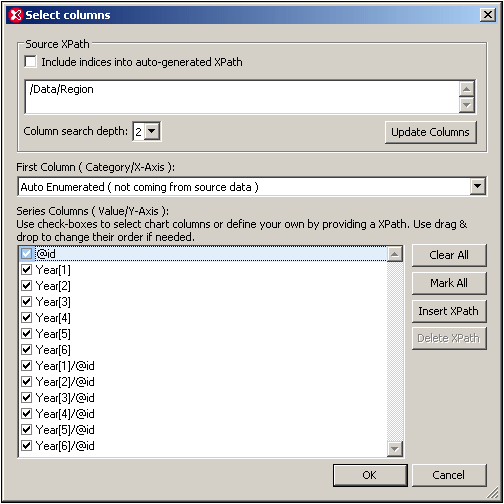
1.In the Select Columns dialog, makes sure that all the required nodes will be available for X-Axis and Y-Axis selection. In the screenshot below, notice that the Column Search Depth has been set to 2 so that the Year/@id attributes are also selected.
2.In the Select Data dialog (screenshot below), the chart data table has the following columns: the first column is the X-Axis selection (which is the Auto-Enumerated selection), the remaining columns are the series (Y-Axis) columns, which are the Region/@id attributes, the Year element contents, and the Year/@id attributes. Notice also that: (i) there are only three rows, so three X-Axis ticks; (but we need six X-Axis ticks for the six years); (ii) there are 13 series columns.
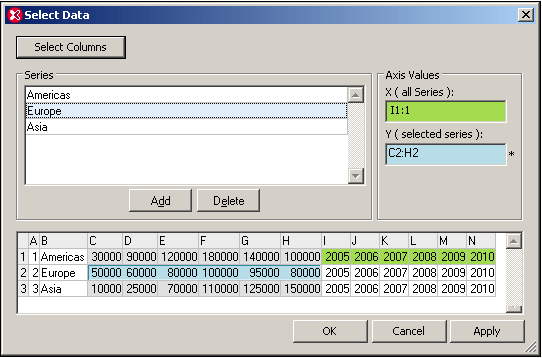
3.In the Series pane, we delete any 10 of the 13 series rows and rename the remaining three series to Americas, Europe, and Asia, as shown in the screenshot above. The order selected here will be the order of the X-Axis tick labeling.
4.In the Series pane, select the Americas series. In the Axis Values pane, click in the X-Axis box to enable modification. Then click the cell I1 in the chart data table and drag to the cell N1. In the Y-Axis text box either enter C1:H1 or make the selection by dragging from C1 to H1.
5.For the Europe and Asia series, select C2:H2 and C3:H3, respectively for the Y-Axis. The X-Axis selection can be the same as that for the Americas series.
6.Click OK. The required chart is generated.
Note: The number of X-Axis ticks (defined by default by the number of rows in the chart data table) is increased from three to six because the number of X-Axis labels is six.
Method 2: Generating series with XPath expressions
In the second method, XPath expressions are inserted to generate series. This is necessary because the Source XPath (see screenshot below) does not have as its descendants the nodes wanted for the series. However, the Source XPath does generate six X-Axis ticks (by selecting the Year elements of the first Region element). In order for the first Region element to be selected using the [1] predicate, the Include Indices check box must be checked and the Update Columns button clicked.
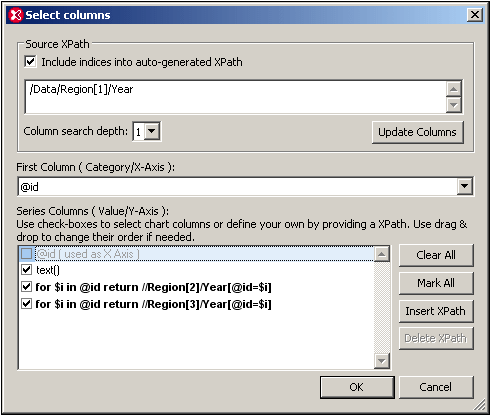
In the Select Columns dialog, the Region[1]/Year element has only two descendants: @id and text(). The @id attribute is selected for the X-Axis, thereby generating the correct X-Axis label for each of the six X-Axis ticks. The chart data table would be evaluated as follows.
Source XPath | X-Axis | Y-Axis (Series columns) | ||
Region[1]/Year[1] | @id | text() | XPath-1 | XPath-2 |
Region[1]/Year[2] | @id | text() | XPath-1 | XPath-2 |
Region[1]/Year[3] | @id | text() | XPath-1 | XPath-2 |
Region[1]/Year[4] | @id | text() | XPath-1 | XPath-2 |
Region[1]/Year[5] | @id | text() | XPath-1 | XPath-2 |
Region[1]/Year[6] | @id | text() | XPath-1 | XPath-2 |
Note that the context node is each of the six Region[1]/Year elements in turn. The first XPath expression looks for the current Year/@id attribute value and returns the Region[2]/Year element that has the same Year/@id value as the @id value of the current Region[1]/Year. The second XPath expression does the same for the Region[3]/Year elements. In this way, for each of the six years: the three Y-Axis series are the Year element children, respectively, of each of the three Region elements. (The text() node returns the contents of the Region[1]/Year elements.)
The chart data table in the Select Data dialog would look something like this.
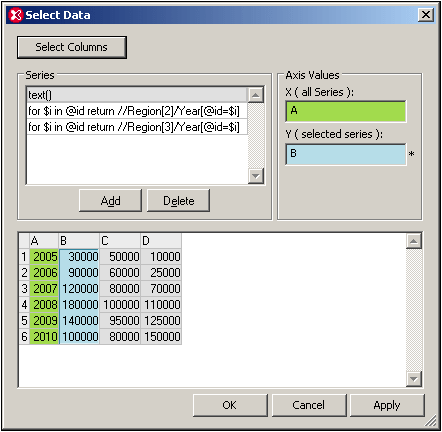
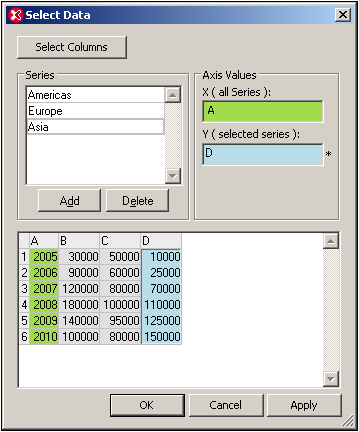
The names of the series in the Select Data dialog can be changed from XPath expressions (as in the screenshot above) into meaningful legends (screenshot below). For each series the correct data column can be assigned in the Axis Values pane (by clicking in the Y-Axis text box and then selecting the required column in the chart data table).
Both the methods shown above generate identical charts. The different approaches are intended to show how the data selection parameters are to be used.