Information Windows
Information windows in the debugger interface contain provide helpful debugging information about the XSLT transformation or XQuery execution. There are eight information windows in XSLT debugging sessions and six in XQuery debugging sessions. These windows are organized, by default, into two groups at the bottom of the debugger interface (see illustration below). These windows are described in this section.
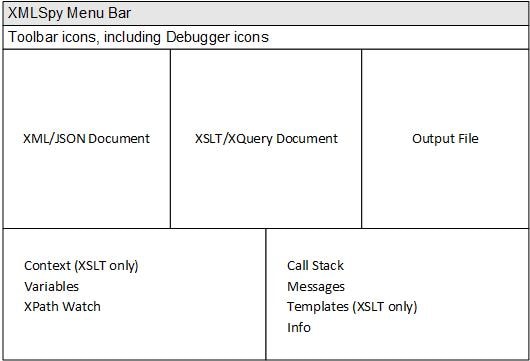
The first group comprises the following information windows:
•Context (XSLT debugging only)
The second group comprises the following information windows:
•Templates (for XSLT debugging sessions only)
•Info
In each group, one tab is active at a time. In some tabs, you can use the information display as navigation tools: clicking an item would take you to that item in the XML, XSLT, or XQuery file.
Managing and using information windows
Note the following visibility and locational features:
•The two information-window groups can be resized by dragging their borders.
•Individual windows can be dragged out of the containing group by clicking the tab name and dragging the window out of the group.
•A window can be added to a group by dragging its title bar onto the title bar of the group. Note, however, that there is no reset button to return the layout to the default layout.
•Individual windows can be hidden/shown by toggling their view off/on in the XSL/XQuery | Debug Windows submenu.
•To float, dock, or hide a window, select the respective command in the window's context menu (obtained by right-clicking in the window).
•To dock a window in another window group or another location, drag the the window by its title bar or tab and drop it at the desired location on the placement control.