Chart Settings: Quick Reference
Chart type
To select the chart type in the Change Type dialog (screenshot below), select the chart type you want and click OK. The Chart Type dialog is accessed by clicking the Change Type button.
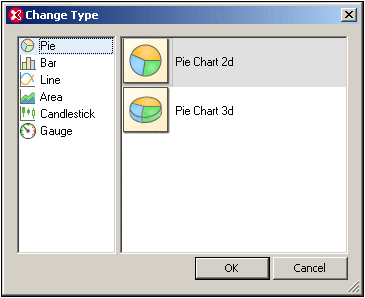
After the chart type has been selected, chart settings (such as title, height, and width) must be made in the Change Appearance dialog (screenshot below) and the chart data must be specified. How data is selected for each chart type is described in the sections, Creating a Chart and Chart Data.
Chart appearance
Chart settings (such as the chart's title, color scheme, and font sizes) are made in the Change Appearance dialog (screenshot below, which shows the Settings dialog of a bar chart). This dialog is accessed with the Change Appearance button and the settings in it are different according to the chart type.
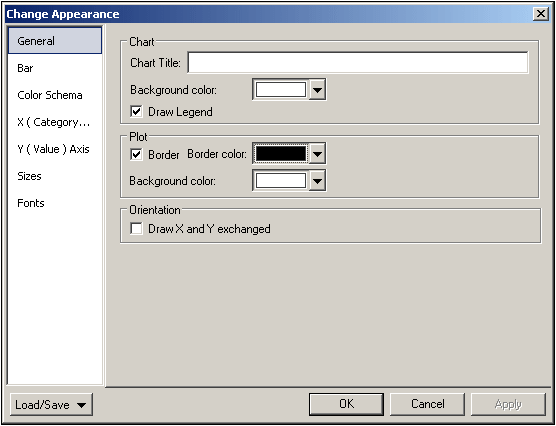
The various settings are organized into the following common tabs:
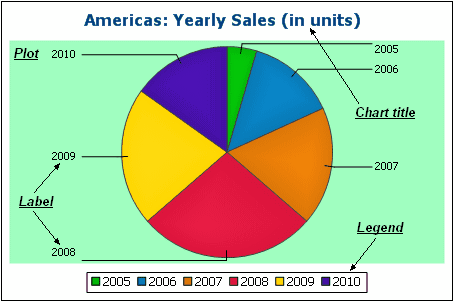
•General: The chart title (see screenshot below) can be edited in this tab, as well as the chart's background color and the plot's border and background color. In the screenshot below, the plot has been given a pale green background color. The legends are at the bottom of the chart; they explain the color codes in the chart and can be turned on or off in the dialog.
•Color scheme: Four predefined color schemes are available plus a user-defined color scheme. You can modify any of the color schemes by adding and/or deleting colors to a scheme. The color scheme selected in the Color Scheme tab will be used in the chart.
•Sizes: Sizes of various aspects of the chart can be set, either as pixels or as a percentage ratio.
•Font: The font properties of the chart title and of legends and labels can be specified in this tab. Sizes can be set as a percentage of the chart size or as pixels.
Additionally, each type of chart has settings specific to its type. These are listed below:
•Pie charts: Settings for: (i) the angle from which the first slice should be drawn; (ii) the direction in which slices should be drawn; (iii) the outline color; (iv) whether the colors receive highlights (in 3D pie charts: whether dropshadows and transparency are used); (v) whether labels should be drawn; and (vi) whether values and percentages should be added to labels and how many decimal places should be added to the percentages.
•Bar charts: Settings for: (General) Drawing the X and Y axes exchanged generates a horizontal bar chart (for 2D bar charts only); (Bar) Bar outlines and dropshadows (dropshadows in 2D bar charts only); (X-Axis) Label and color of the x-axis, and vertical gridlines; (Y-Axis) Label and color of the y-axis, horizontal gridlines, the range of values to be displayed, and the tick marks on the y-axis; (Z-Axis, 3D only) Label and color of the z-axis; (3D) the vertical tilt, horizontal rotation, and the width of the view.
•Line graphs: Settings for: (General) Drawing the X and Y axes exchanged; (Line) including the plot points or not; (X-Axis) Label and color of the x-axis, and vertical gridlines; (Y-Axis) Label and color of the y-axis, horizontal gridlines, the range of values to be displayed, and the tick marks on the y-axis.
•Gauge: Settings for: (i) the angle at which the gauge starts and the angular sweep of the scale (Round Gauge only); (ii) the range of the values displayed (Round and Bar Gauges); (iii) the interval and color of major and minor ticks (Round and Bar Gauges); (iv) colors of the dial, the needle, and the border.