X and Y Axes
The X and Y axes determine, respectively, the columns and rows of a table. For each axis, one or more hierarchical breakdowns are defined (see screenshot below). The breakdown/s corresponding to a single axis are resolved into a single “effective” breakdown. If there is only one breakdown for an axis, then this breakdown will be the effective breakdown. If there are multiple breakdowns defined for an axis, the resolution method is as described further below in Projections for multiple breakdowns.

Note the following axes-related properties and editing features:
•In table definitions, the X axis corresponds to columns of the generated table, while the Y axis corresponds to the table rows (in the screenshot above, see the table layout preview).
•Each axis can have one or more breakdowns (see Projections for multiple breakdowns below).
•Each cell in the generated table has an orange-yellow background color. In the table definition, a cell corresponds to a definition node in a breakdown of the axis.
•When a cell is selected its corresponding definition node is also selected, and vice versa. The background color of cells of selected components is purple.
•When a component is selected, its properties are displayed in the Details entry helper and can be edited there (see screenshot above).
•Data cells have no background color. They are always empty because the taxonomy itself does not contain any facts.
•Cell constraints are calculated from the axes (using tag selectors if present) and displayed in the Constraints tab of the Details entry helper. See the screenshot in the section, Z Axis.
Projections for multiple breakdowns
Multiple independent breakdowns may be associated with a single table axis. The mechanism for resolving how multiple breakdowns combine into a single “effective” breakdown is called projection. The relative priority of multiple breakdowns for a single axis is determined by the @order attribute of each breakdown. The breakdowns are visualized as trees. For each leaf of the first breakdown, the entire second breakdown is attached, and so on, recursively.
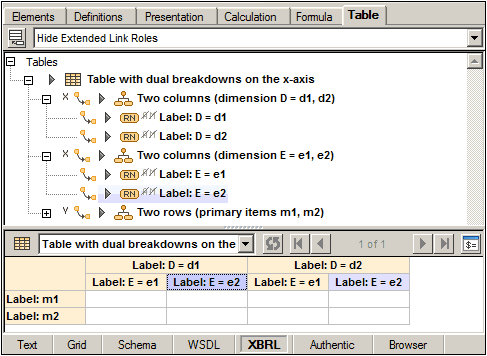
In the screenshot below, for example, there are two breakdowns for the X axis: dimension D is ordered at a higher priority than dimension E. So, for each leaf of dimension D (d1 and d2) the entire tree of dimension E is attached. Since the X axis generates columns, these breakdowns create a projection for the column structure of the table. See the table layout preview in the screenshot below.