Mechanism and Interface
The broad mechanism used for debugging XSLT and XQuery files is given below.
Open a debugging session
You can open a debugging session from an XML, JSON, XSLT, or XQuery document by selecting the XSL/XQuery | Start Debugger / Go command.
The XSLT/XQuery Debugger works only in Text View and Grid View. If the active document is not in Text View or Grid View when you start the debugging session, then you will be prompted for permission to change to Text View, which is the default view of the XSLT/XQuery Debugger. You can, in the Debugger Settings dialog, also choose to set this option permanently.
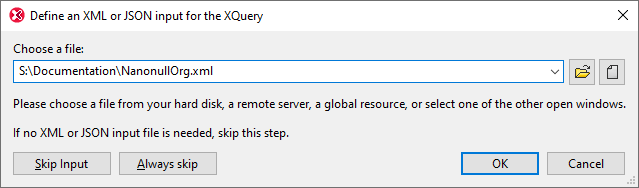
If the active document requires an associated file and if this file has been assigned to the active file, then the debugging session is started immediately. (For example, an XML document could have an XSLT stylesheet assigned to it via an xml-stylesheet processing instruction.) Otherwise, you are prompted to select the required associated file. Note, however, that since XQuery files neither require nor contain an XML/JSON file association, you can choose to be prompted for an optional XML/JSON file association or not each time you start an XQuery debugging session (see screenshot below).
The Debugger toolbar with Debugger icons appears automatically when a debugging session is started.
Debugger interface
The XSLT/XQuery Debugger interface is shown in the diagram below. Alternatively to the view of the three documents (XML/JSON, XSLT/XQuery, Output) shown below, you can opt for a view of two documents (XSLT/XQuery and Output) or a view of any one of the documents. To do this, select the appropriate command from among the Debugger's three view commands.
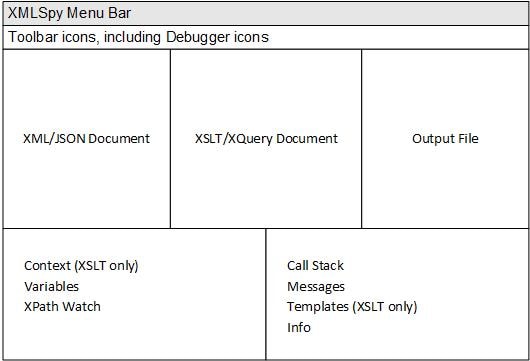
Information windows in the interface (see screenshot above) provide information about various aspects of the transformation/execution (Variables, XPath Watch, Call Stack, Messages, Info, etc). See the topic lInformation Windows for details.
Debugging
There are two broad ways to go through the XSLT or XQuery document:
•Use the XSL/XQuery | Start Debugger / Go command to go through the entire transformation/execution, stopping only at breakpoints. If no breakpoint has been set, then the transformation/execution is carried out in one step and no debug results are shown.
•Use the Step Into, Step Out, and Step Over commands to step through the XSLT or XQuery document. If an XML file is associated with the session, the corresponding locations in the XML file are highlighted. Simultaneously, output for corresponding steps is generated in the output file. Consequently, you can see what is happening at each step of the transformation and note any effects you might want to change.
Breakpoints can be set in any of the documents (XML or XSLT/XQuery) to interrupt the processing at selected points. This speeds up debugging sessions since you do not need to step through each statement in the XSLT or XQuery document. See the topic Breakpoints for more information. Additionally, tracepoints can be set in the XML/JSON or XSLT/XQuery documents to separately view the output of individual instructions. See the topic Tracepoints for more information.
During a debugging session, you can stop the debugger (not the same as ending the debugging session; see below) with the XSL/XQuery | Stop Debugger command. When the debugger has been stopped, the XSLT/XQuery Debugger interface stays open and you can edit any of the documents. All XMLSpy editing features will be available for editing in the debugger interface. You can restart the debugger (from the beginning of the XSLT/XQuery document) by selecting XSL/XQuery | Start Debugger or XSL/XQuery | Step Into.
Stop the debugging session
Select XSL/XQuery | End Debugger Session to close a debugging session and return you to your previous XMLSpy environment. The information windows will be closed, but breakpoint and tracepoint information is held till the file is closed. (As a result, if you start another debugging session involving a file containing breakpoints, the breakpoints will apply in the newly opened debugging session.)