Document Display
In Grid View an XML, JSON, or DTD document is displayed hierarchically within a grid (see screenshots below: XML document at left, JSON document at right).


XML documents
Each XML grid line contains one XML structural item (known as a node), such as an element, attribute, comment, or text. The node types that are available in XML documents are listed in the screenshot below together with their icons.
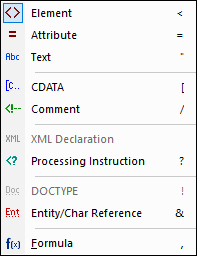
In an XML grid cell, the type of the XML node is indicated by the icon in the top left of the cell (see XML screenshot at topic start). You can change a node's type by clicking its icon and selecting another node type from the list of types that appears (screenshot above). Note that nodes of type Element, Attribute, and Processing Instruction have a name and a value, whereas nodes of type Text, CDATA, and Comment have only a value. For example, an element node will have a name and a value, whereas a text node will have only a value.
Note: Formulas are specific to XMLSpy.
JSON/YAML documents
Each JSON or YAML grid line contains one of the data structures shown in the table below (with their symbols). Note that both arrays and objects can contain child components that may be objects, arrays, or atomic values. In the JSON screenshot at the start of the topic, we see a root object that contains two key:value pairs: (i) "Title":"Music Library", (ii) "Artists":[Array]. The array keyed to Artists contains four items that are objects.
{} | An object (see definition). Objects contain key:value pairs. In YAML, objects are called mappings. |
[] | An array (see definition). Arrays contain items, which are typically objects or values. In YAML, an array is a sequence. |
// | Comments in JSONC, JSON5, and YAML |
A key:value pair (see definition). |
In a JSON or YAML grid cell, the type of the node is indicated by the icon in the top left of the cell (see the JSON and YAML screenshots at topic start). You can change a node's type by clicking its icon and selecting another node type from the list of types that appears (see screenshot below).
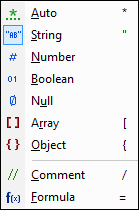
Note: Comments are supported in JSONC, JSON5, and YAML. Formulas are specific to XMLSpy.
Note: The context menus of YAML documents additionally enable you to create an Alias type. After you add an alias and start typing its anchor reference, the names of matchable anchors are displayed in a dropdown list.
DTD documents
For a description of the Grid View features of DTD documents, see the DTD topic.
Features of document display in Grid View
Note the following features:
•You can zoom the grid in and out via Ctrl + Mouse Wheel, or Ctrl+[Plus] and Ctrl+[Minus].
•XML elements at the same level and JSON/YAML objects, array, and array items at the same level are numbered, starting from 1. In the XML screenshot at the start of the topic, for example, the Office element that is numbered one is the first of a sequence of Office elements. The other elements in the screenshot are not numbered—because they do not have sibling elements of the same name. In the JSON screenshot, for example, within the Artists array, the objects are numbered from 1 to 4. So also within the Albums and Tracks arrays. Note that this numbering is not contained in the actual document, but is a Grid View feature to help you see the structure of the document.
•XML nodes and JSON/YAML objects and arrays can be expanded or collapsed by clicking the arrowhead icon at the left of the node's symbol (see screenshots at start of topic). When an XML, JSON, or YAML node is collapsed, any content it has is displayed as text in a single line. For examples, see the last three grid lines of the JSON screenshot at the top of the page.
•If you select multiple components at the same level, you can expand/collapse all of them by pressing Shift and clicking any one of the selected components' arrowheads.
•If word-wrap is switched on via the Grid View toolbar (see below), then all cells containing text that is longer than the width of the cell will wrap. You can toggle off word-wrap by clicking its icon in the Grid View toolbar.
•Notice that node/content items in XML Grid View and key:value pairs in JSON or YAML Grid View are represented on one line in Grid View's standard mode. However, when they are part of Table Display, the node name (XML) or key name (JSON/YAML) become the column headers of tables. For a brief description of Table View, see the relevant sections below.
Scroll headers
As you scroll down an XML, JSON, YAML or DTD document in Grid View and nodes at the top of the window go out of the view window, a header bar appears at the top of Grid View (see screenshot below). This header bar—or scroll header—displays all the ancestor elements of the node currently at the top of the view window. For example, in the screenshot below, the node at the top of the view window is the attribute /Company/Person[1]/@Programmer node. Its parent is the first Person element, and the parent of this Person element is the root element, which is named Company. So the ancestors of the topmost node in the view window (@Programmer) are the root element Company and the first Person element, and these are displayed in the header bar: /Company/Person[1]/.
If you click any node in the header bar, then that node will be selected and displayed in the view window. The header bar, in this way, enables you to quickly navigate the document in Grid View.
Toolbar commands
Commands related to Grid View editing can be accessed quickly via the respective Grid View toolbar for XML or JSON/YAML (screenshots below), located in the toolbars area at the top of the application window. The toolbar that is displayed will depend on the currently active document. Hover over a toolbar icon to see its name and shortcut.


Note: The commands accessible via these toolbars are also available in the XML menu and JSON menu, respectively.
Display-related commands
The commands in the table below are useful for modifying the display in Grid View.
| Optimizes widths of grid columns according to cell content. |
When colored, Table Display is on, otherwise off. Click to switch the display | |
When colored, a filter for the table, object, or array is active; otherwise the filter is deactivated. Click to deactivate/activate. To edit the expression, double-click it | |
| Toggle command to word-wrap cells. When selected, word-wrap is on. By default. only the contents of items are wrapped. If you want to additionally wrap the names of items, choose this option from the icon's dropdown list. |
| Zoom level of Grid View |
Filtered display
A filter can be placed on element nodes (XML) or array or object nodes (JSON). This enables you to filter the node to show only the descendants defined in the filter. For a detailed description of filters, see the topic Filters.
Table display (XML)
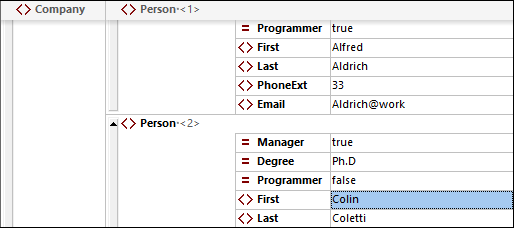
Repeating elements are shown in standard Grid View, one after the other, progressing vertically downward in document order (screenshot below left). However, displaying repeating elements as the rows of a table provides additional editing features. In the screenshots below, the Person element is the repeating element. The screenshot at left shows standard Grid View; the first Person element is shown expanded, while subsequent instances are shown collapsed. The screenshot at right shows the repeating Person elements as the rows of a table.
To switch to Table View, click the Table Mode icon (circled in green in the screenshot below left). When switched to table display, the icon is displayed in color (see screenshot below right).

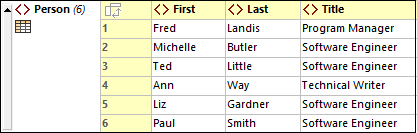
Table View offers unique editing benefits in that whole rows and columns can be manipulated relative to other columns and rows in the table. This enables such operations as sorting table rows on the values of one column. For example, in the screenshot above right, the six Person elements can be sorted on the basis of their Last child elements via a single command in the Grid View toolbar. This is simpler than running an XSLT transformation, which would be the usual way to sort an XML nodeset.
For more information, see the topic Table Display (XML).
Table display (JSON/YAML)
Objects and arrays that contain at least one object or array can be viewed either as a list (highlighted in screenshot at left) or as a table (highlighted in screenshot at right). The display can be switched between list display and table display for individual objects and arrays.


For a description of JSON Grid View's Table Display, see the section Table Display (JSON).