Output Window: XPath/XQuery
The XPath/XQuery Window (screenshot below) enables you to build, evaluate, and debug XPath and XQuery expressions with respect to XML or JSON documents. (Features that enable JSON queries were introduced in XPath/XQuery 3.1. See JSON Transformations with XSLT/XQuery.)
This section provides a brief overview of the main features of XPath/XQuery Window. For a detailed description of how to work with XPath/XQuery Window, see the section XPath/XQuery Expressions.
Note: The output window has nine tabs. You can, therefore, keep an output in one tab and get a new output in another tab.
Main features
The XPath/XQuery Window provides the following main features:
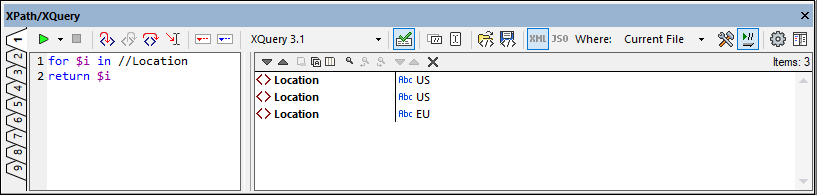
•Evaluation Mode: In Evaluation Mode, an XPath or XQuery expression is evaluated with respect to one or more XML/JSON documents. The expression is entered in the Expression pane, and the result is displayed in the adjoining Results pane. You can click nodes in the result to go to that node in the XML or JSON document. See the section XPath/XQuery Expressions for details.
•Debug Mode: In Debug Mode, you can debug an XPath/XQuery expression as it applies to the currently active XML document. You can set breakpoints and tracepoints, and go step-by-step through the evaluation. At each step you can see the content of variables, as well as set custom Watch expressions to check additional aspects of the evaluation. See the section Debugging the Expression for details.
•Expression Builder: An Expression Builder provides entry helpers and information popups to help you construct syntactically correct expressions. See the section Expression Builder for details.
•Support for multiple languages: You can switch language versions from XPath 1.0 to XPath 3.1 and XQuery 3.1. The expression that you enter will be evaluated according to the rules of the selected language.
•Open and save expressions from/to file: You can save an XPath/XQuery expression, together with the current settings of the window, to an XQuery file, and you can load expressions from an XQuery file.
•Auto-detection of file type (XML/JSON): The filetype of the current document (XML or JSON) is automatically detected and the correct target-document mode is automatically set. If the scope is a set of documents, you can manually select the target document type.
•Flexible scope for target documents: In the Where field, you can select whether the expression is tested on the currently active file, all open files, the current project, or a folder.
•Options for the Result Window and Watch Window: You can define how items in the Results Window and Watch Expressions Window are to be displayed.
•Results link directly to documents and document nodes: Lines in the Results pane contain links to the relevant documents or document nodes. This enables you to go directly to specific nodes and check data there.
•Debugger analytics: In Debug Mode, a wide range of analytical information is displayed. Additionally, you can set custom expressions to check additional aspects of the evaluation.
For a detailed description of the XPath/XQuery Window features, see the section XPath/XQuery Expressions, in which all the modes, icons, and functionality available in the toolbar are described..