Debugging the Expression
The Debug Mode of the XPath/XQuery Window (screenshot below) enables you to debug an XPath/XQuery expression as it applies to the active file.
In Debug Mode, two additional panes are added to the Results pane (see screenshot below):
•the Watch Expressions and Variables pane; both watch expressions and variables are shown together in the same pane, with variables being able to be toggled on/off
•the Call Stack and Debug Points pane, each of which has a separate tab in the pane
The Expression and Result panes can adjoin each other horizontally or vertically. To switch between these layouts, click the Horizontal/Vertical Layout button (at top right of the window's toolbar).
Debugger Mode offers the following features:
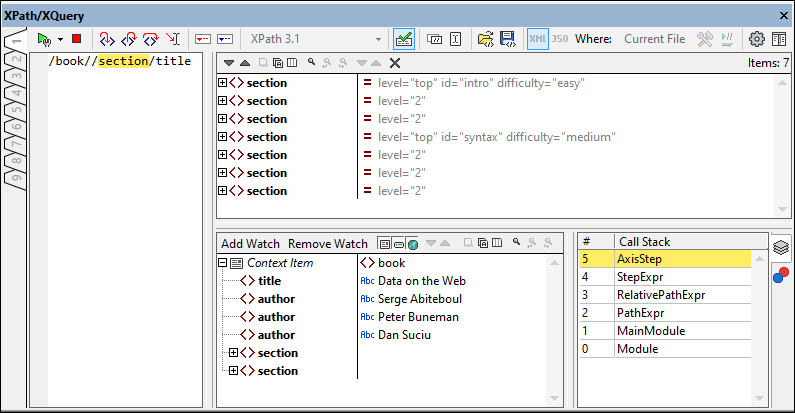
•Enables you to step into the XPath evaluation process, one step at a time to see how the XPath expression is being evaluated. Use the Step Into (F11) toolbar button for this. At each evaluation step, the part of the expression being currently evaluated is highlighted in yellow (see screenshot above), while the result of evaluating that step is shown in the Results pane. For example, in the screenshot above, all the section descendant elements of the book element have been selected, whether they occur as child elements of book or are nested further below.
•The Watch Expressions and Variables pane always shows the context node of the expression step that is being being currently evaluated. So, in the screenshot above, for example, the expression step being currently evaluated is //section. Its context node is book. So the book node (and its content) is displayed as the context item.
•Set breakpoints where you want to pause the evaluation and check results at these points. You can then step through the evaluation by pausing only at breakpoints. Use the Start Debugging (F5) toolbar button for this. This is quicker than pausing at every step with Step Into (F11).
•Set tracepoints to see a report of results at the steps marked as tracepoints. The evaluation will not pause (except at breakpoints), but all the tracepoint results will be displayed together in a list in the Results pane.
•Watch expressions can be used to check information (such as document content or aspects of the evaluation) as the evaluation progresses. Of great use is the display of the context item in the same window. This enables you to assess how the result of the watch expression relates to the context item. You can enter multiple watch expressions, which is useful to compare results of different expressions within the same context item.
•Variables that are in scope, including their values, are displayed in the Watch Expressions and Variables pane. You can toggle on/off global and variables separately. It can be very useful to see the values of variables within a context item together with the result of watch expressions.
•Processor calls of an evaluation step are shown in the Call Stack tab of the Call Stack and Debug Points pane.
•If breakpoints and tracepoints have been set, then these are displayed in the Debug Points tab of the Call Stack and Debug Points pane.
For more information about these features, see their descriptions below.
Setting up Debug Mode
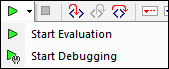
To switch to Debug Mode, click Start Debugging in the dropdown menu of the Start Evaluation/Debugging (F5) command (located at top left of the toolbar; see screenshot below). When in Debug Mode, the Watch Expressions pane and Call Stack and Debug Points pane will appear. To start debugging the current expression, click Start Debugging or F5.
Note that Debug Mode works only with the current file; it cannot be used with multiple files. As a result, the Where option will automatically be set to Current File when you switch to this mode and cannot be changed.

|


Running the Debugger
The broad steps for debugging an XPath/XQuery expression are, typically, as follows:
1.Make the XML/JSON file on which you wish to run the expression the active file.
2.Select the XPath/XQuery(Update) version of the expression you want to debug.
3.Enter the XPath/XQuery expression in the expression pane.
4.Set any breakpoints or tracepoints you want. A breakpoint is a point at which the evaluation is paused. A tracepoint is a point in the evaluation that is recorded; tracepoints thus provide a traceable path of evaluation results.
5.If you click Start Debugger, evaluation is carried out in one step to the end unless a breakpoint has been marked in the expression. Click Start Debugger repeatedly to progress through each breakpoint to the end of the evaluation.
6.Use the Step Into/Out/Over functionality to go step-by-step through the evaluation. You can also use the Run to Cursor functionality to go directly to the expression step where you place the cursor
|


Stepping in, out, and over evaluation steps
The Step Into functionality enables you to go step-by-step through the evaluation. Each click of this command takes you through the next step of the evaluation; the current step is shown by the highlighting in the expression (see screenshot below). The Step Out functionality takes you to a step on a higher level as the current step, whereas the Step Over functionality steps over lower-level steps and takes you to the next step on the same level. You can try out the Stepping functionality by pasting the XQuery 3.1 expression given below into the Expression pane and clicking the three Step buttons to see how they work.

declare function local:plus($a, $b) { $a + $b };
declare function local:loop() { for $i in 1 to 10 return (local:plus($i, $i+1), local:plus($i+1, $i+2)) };
local:loop() |
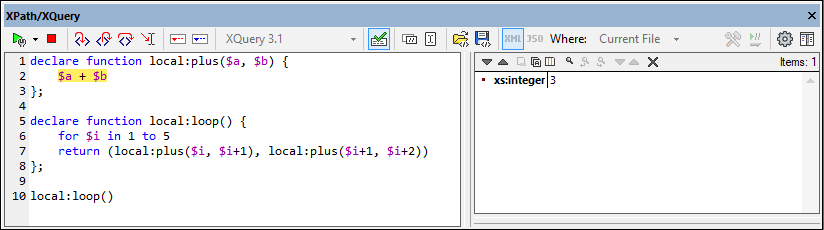
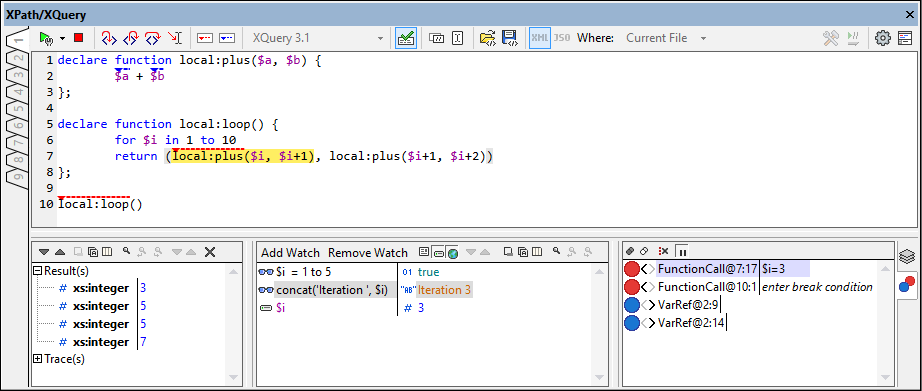
The screenshot below shows the evaluation when processing has been paused on reaching the addition step $a + $b during the first pass through the loop—that is, when $i=1. At this addition step, the result shows 3 (as a consequence of 1+2).
Breakpoints
Breakpoints are points where you want the Debugger to stop after it has been started with Start Debugger. They are useful if you wish to analyze a specific part of the expression. When the Debugger stops at the breakpoint, you can check the result and could then use the Step Into functionality to display the results of the next steps of the evaluation. To set a breakpoint, place the cursor in the expression at the point where you want the breakpoint, and click the Insert/Remove Breakpoint (F9) toolbar button. The breakpoint will be marked with a dashed red overline. To remove a breakpoint, select it and click Insert/Remove Breakpoint (F9).
Also see Debug Points below.
Tracepoints
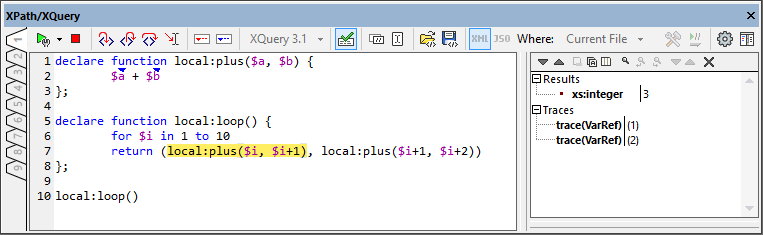
Tracepoints are points at which the results are recorded. These results are displayed in the Traces tree of the Result tab (see screenshot below). This enables you to see all the evaluation results of particular parts of the expression. For example, in the screenshot below, tracepoints have been set on $a, $b, and local:plus($i, $i+1); the results at these tracepoints during the first iteration through the loop are shown in the Traces tree: $a=1, $b=2, and local:plus($i, $i+1)=3.
To set a tracepoint, place the cursor at the point where you want the tracepoint, and click the toolbar button Insert/Remove Tracepoint (Shift+F9). The tracepoint will be marked with a dashed blue overline (see screenshot below). To remove a tracepoint, select it and click Insert/Remove Tracepoint (F9).
Note: If both a breakpoint and a tracepoint are set on a part of the expression, then the overline is composed of alternating red and blue dashes.
Also see Debug Points below.
Watch Expressions and Variables
Watch expressions and variables are displayed in the Watch Expressions and Variables pane (bottom center pane in the screenshot below).

Watch expressions
Watch expressions are expressions that you can enter, either before evaluation starts or during a pause in evaluation. They can be used for the following purposes:
•To test specific conditions. For example in the screenshot above, the watch expression $i=1 to 5 is used to test whether the $i variable has a value in the given range at any given time during processing. The result true tells us that this condition has been met in the current processing context.
•To find data within a certain context. For example, within the context of a Company element, we could enter a watch expression @id to look up that company's customer code in the target XML document.
•To generate additional data. For example in the screenshot above, the watch expression if ($i=1 to 5) then (concat("Iteration ", $i)) else "Out of Loop" can generate a suitable string to indicate in which iteration of the loop the evaluation currently is.
To enter a watch expression, click Add Watch in the pane's toolbar, then enter the expression and click Enter when done. To remove a watch expression, select it and click Remove Watch in the toolbar. If, during debugging, the expression cannot be correctly evaluated for some reason (for example, if one of its variables is out of scope), then the watch expression turns red.
Variables
Variables that have been declared in the expression and that are in scope in the current evaluation step will be displayed together with their respective current values. For example, in the screenshot above, processing has just reached the call to the local:plus function. The $i variable is in scope within the local:loop function and has just been incremented to 2. So $i is displayed with its current value. You can toggle on/off the display of local and global variables by clicking their respective toolbar icons.
Icons of the pane
Note the availability of the following features via the icons of the pane.
Icon | What it does |
Next, Previous | Selects, respectively, the next and previous item in the result list |
Copy the selected text line to the clipboard | Copies the value column of the selected result item to the clipboard. To copy all columns, toggle on the Copying includes all columns command (see below) |
Copy all messages to the clipboard | Copies the value column of all result items to the clipboard, including empty values. Each item is copied as a separate line |
Copying includes all columns | Switches between copying (i) all columns, or (ii) only the value column. The column separator is a single space |
Find | Opens a Find dialog to search for any string, including special characters, in the result list |
Find previous | Finds the previous occurrence of the term that was last entered in the Find dialog |
Find next | Finds the next occurrence of the term that was last entered in the Find dialog |
Expand with children | Expands the selected item and all its descendants |
Collapse with children | Collapses the selected item and all its descendants |
Clear | Clears the result list |
Call stack
The Call Stack tab of the Call Stack and Debug Points pane (bottom right pane in the screenshot above) displays the processor calls up to that point in the debugging. The current processor call is highlighted in yellow. Note that only the calls that directly led to the current evaluation step are displayed. For example, in the screenshot above, the current evaluation step is an arithmetic calculation expression within a function call to the local:plus function. Now, although this is the second iteration of local:loop, the processor calls of the first iteration are not displayed. This is because those calls are on a parallel level to the current function call and did not lead to it.
Debug points
The Debug Points tab of the Call Stack and Debug Points pane (bottom right pane in the screenshot below) shows the breakpoints (with red circles) and tracepoints (blue circles) that you have set on the expression. Each debug point (breakpoint or tracepoint) is listed with its line and character number. For example, FunctionCall@7:17 means that there is a debug point on line 7, character 17.
Note the following features:
•For breakpoints, you can enter a break condition by double-clicking Enter break condition, entering the expression for the condition, and pressing Enter. That breakpoint will be enabled only when the break condition evaluates to true. For example, in the screenshot above, the break condition $i=3 will enable the breakpoint on this function-call only when the value of $i is 3. The screenshot shows the evaluation paused at this breakpoint.
•You can enable/disable all debug points by clicking their respective toolbar buttons: Enable All Debug Points and Disable All Debug Points. When a debug point is disabled, it is deactivated for all evaluations till it is enabled again.
•You can also enable/disable breaks in processing when a processing error is encountered by toggling on/off the corresponding toolbar icon.
•You can enable/disable individual breakpoints in their respective context menus and by clicking their circle icons. When a circle icon is gray, the debug point has been disabled.
Display options
When you click the Show Options button (gear icon) at the top right of the XPath/XQuery a dialog appears in which you can specify display options of the Result pane and the Watch Expressions and Variables panes. You can choose to display, for each pane separately:
•results as an expandable tree structure or as a serialized XML string (a node is shown as a text string, just as it is written in an XML document), and
•attributes inline, which means that attributes and their values are shown on the same line as the element (additional to being shown in the tree structure of the node).