Viewing the History of Values Processed by a Connector
If the option Keep full trace history is enabled (see Debugger Settings ), you can view the history of all values that were processed by that connector (up to the current execution position).
The history is displayed when you click a connector, and then click the History tab of the Values window. Note that this operation is meaningful only for connectors that have processed values since the beginning of mapping execution until the current debugger position.
To illustrate this case, let's debug a mapping from begging till end without using any breakpoints, and then watch the history of all values that were processed by a particular connector. First, open the mapping PreserveFormatting.mfd from the <Documents>\Altova\MapForce2026\MapForceExamples\ directory. If it is already open, make sure to do the following:
•Clear any breakpoints, if such exist (see Adding and Removing Breakpoints )
•Stop debugging if it is currently in progress, by pressing Shift + F5.
When ready, press F5 start a new debugging operation. When you press F5, MapForce executes the mapping in debug mode, and switches to the Output pane. Click the Mapping pane to go back to the main mapping window, and then click the result node of the format-number function (highlighted in red in the image below). Finally, click the History tab of the Values window, and notice the displayed values.
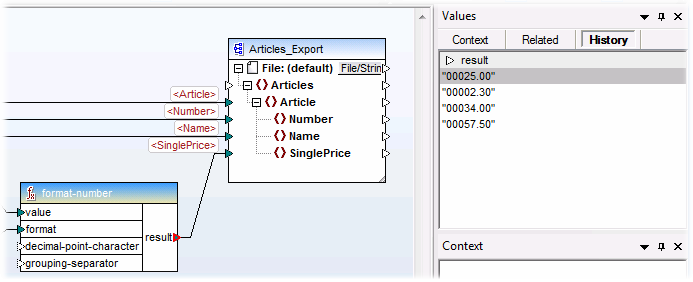
As shown in the image above, this particular node (result) has processed four values in total. If you need additional information about a particular value, remember that you can recreate the context that produced it (see Setting the Context to a Value ).