XSLT Debugger

Debugging and Back-mapping to Perfect Your XSLT

  • Support for XSLT 1.0, XSLT 2.0, XSLT 3.0
  • XSLT back-mapping
  • Click output to identify source node / instruction
  • Step-by-step node transformation
  • Stepping into, out, and over nodes
  • Setting breakpoints and tracepoints
  • Context information window
  • Call stack window
  • XML, XSLT, and output panes displayed in parallel
  • XSLT Profiler and XSL Speed Optimizer
  • Debugging XSLT containing Java, JavaScript, C#, & VBScript

Debugging with XSLT Back-mapping

Debug with XSLT backmapping

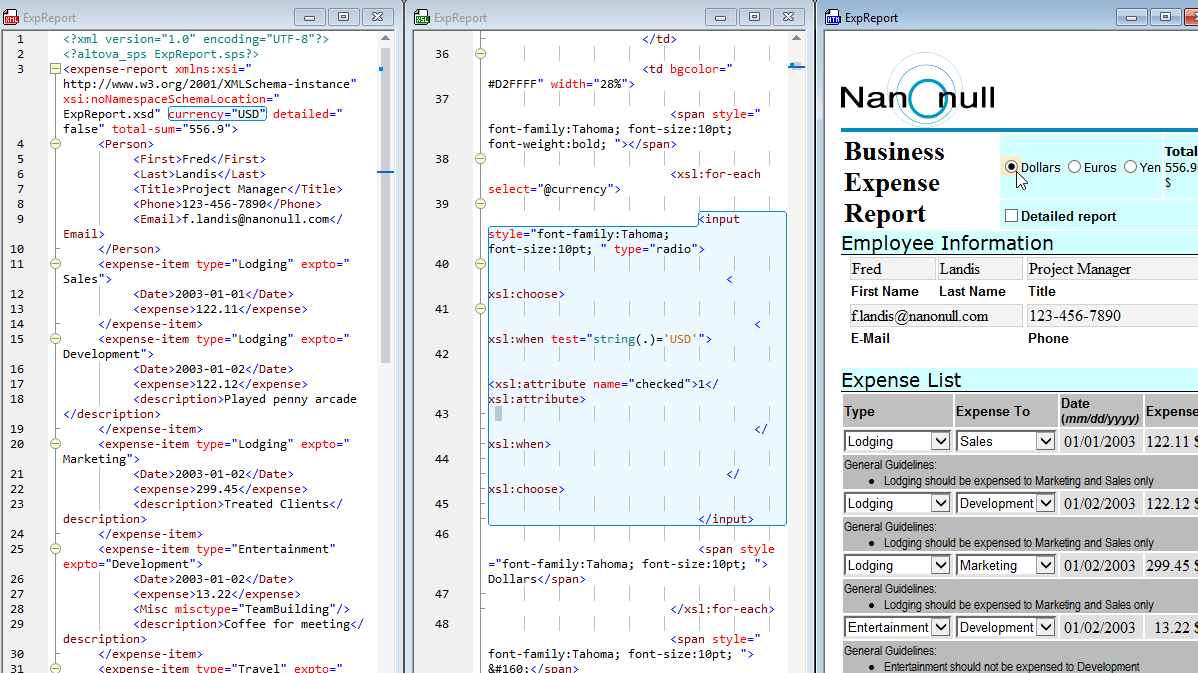
When you enable back-mapping via the tool bar button, XSLT transformations will be carried out so that the result document can be mapped back on to the originating XSLT+XML documents. This means that when you click on a node in the result document, the XSLT instruction and the XML source data that generated that particular result node will be highlighted.

The back-mapping button also gives you the option to automatically tile the source, XSLT/XQuery, and result documents after transformation for easy review, as shown to the right.

You can click the transformed output in either text or browser view to back-map. What’s more, when you view the HTML output in Browser view, you can simply mouse-over the desired section and XMLSpy will automatically highlight the source XML node and XSLT expression.

Video of Debugging XSLT with Back-mapping

Why choose XMLSpy?

Back-mapping in XMLSpy is revolutionary in two ways.

First, it will save you incredible amounts of time in debugging, refining, and perfecting your code as well as understanding inherited code written by other team members.

Second, XMLSpy does not make any changes or add additional code to the output document in order to achieve back-mapping!

XSLT Debugger

For more indepth testing, you can use the XMLSpy XSLT Debugger.

XSLT debugger

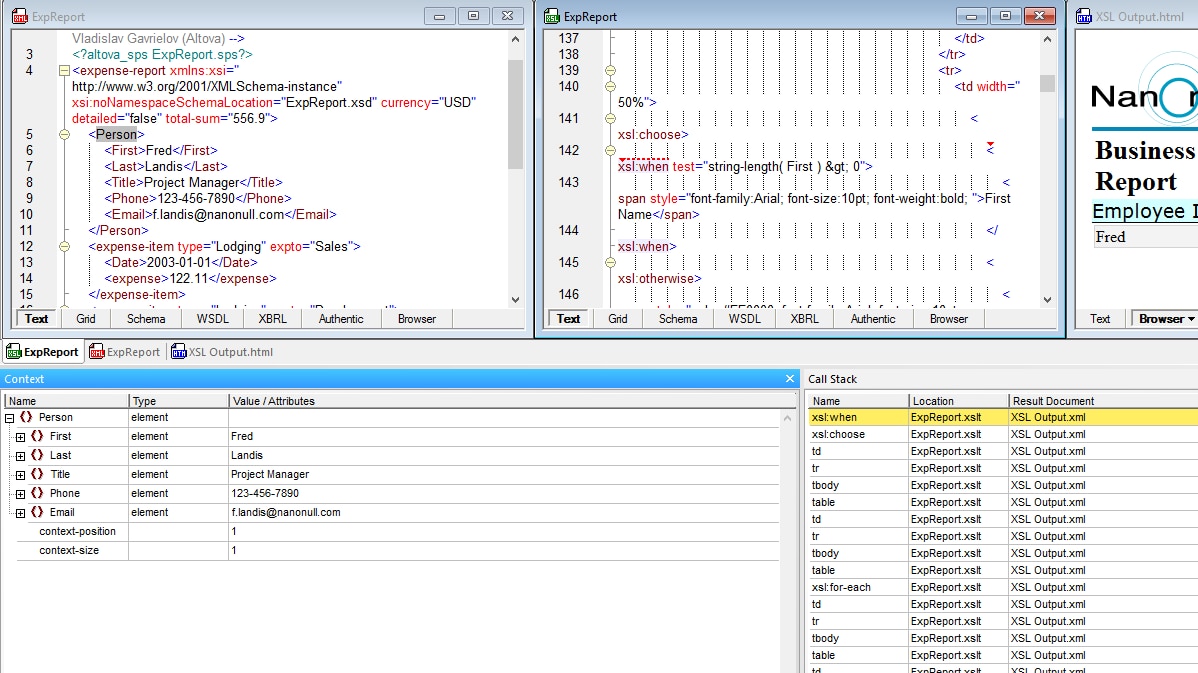
The XSLT debugger includes a three-panel interface that displays the XML document, the associated XSLT stylesheet, and the output document as it is being built in real-time. Below the three panels, Context and Callstack information windows include multiple tabs that supply all the necessary debugging information.

Step-by-step Debugging

The XSLT debugger allows you to move through the transformation step-by-step, and you can step into, step out, and step over nodes. It highlights the current instruction in the XSLT and the current node in the XML file, and produces output for each step, highlighted in the output pane. Seeing all three factors at the same time provides you with an immediate visual understanding of the way that your code is rendering the XML data.

Context Window

As you’re debugging a stylesheet, the XSLT debugger presents you with several useful pieces of information. To supplement the information shown in the output pane and Trace window, the debugging information windows display additional important details in the Context Window:

  • Context: displays the context node and associated attributes or value(s).
  • Variables: displays the global, local, and parameter based variables as well as the name and variable value.
  • XPath Watch: displays the result of XPath expressions, which are evaluated against the root or context node, depending on how they are entered. You can define the XPath expressions you want to monitor here.

Call Stack Window

Tabs in the Call Stack info window include:

  • Call Stack: displays a list of the previously processed XSL instructions and templates, with the current instruction appearing at the top of the list.
  • Templates: displays all templates used while debugging the current XSLT file. This includes the provided default templates in the built-in template, as well as any included or imported templates.
  • Info: displays information about the type of debugging (XSLT 1.0, 2.0, or 3.0), the files used, and the debugger status.
  • Messages: displays the xsl:message instruction(s) or any error messages that may occur during debugging.
  • Trace: displays output information for each tracepoint.