MapForce makes it easy to convert data with visual, drag-and-drop data mapping.
MapForce converts geospatial data between JSON, GeoJSON, KML, CSV, Excel, XML, databases, and other formats using visual drag-and-drop mapping. Because KML is XML and GeoJSON is JSON, MapForce works with both natively — mapping coordinates, placemarks, geometry and attribute data field by field. Every conversion is saved as a reusable mapping you can re-run or schedule.
You can even use the optional Altova AI Assistant to generate connections from your source and target structures. Altova AI analyzes the data structures, generates the field connections, suggests transformation functions, and produces an executable project with defined data flows and processing steps, all in the standard MapForce graphical environment. The process is interactive: review each suggested connection and accept or decline it individually, or apply all the changes at once.
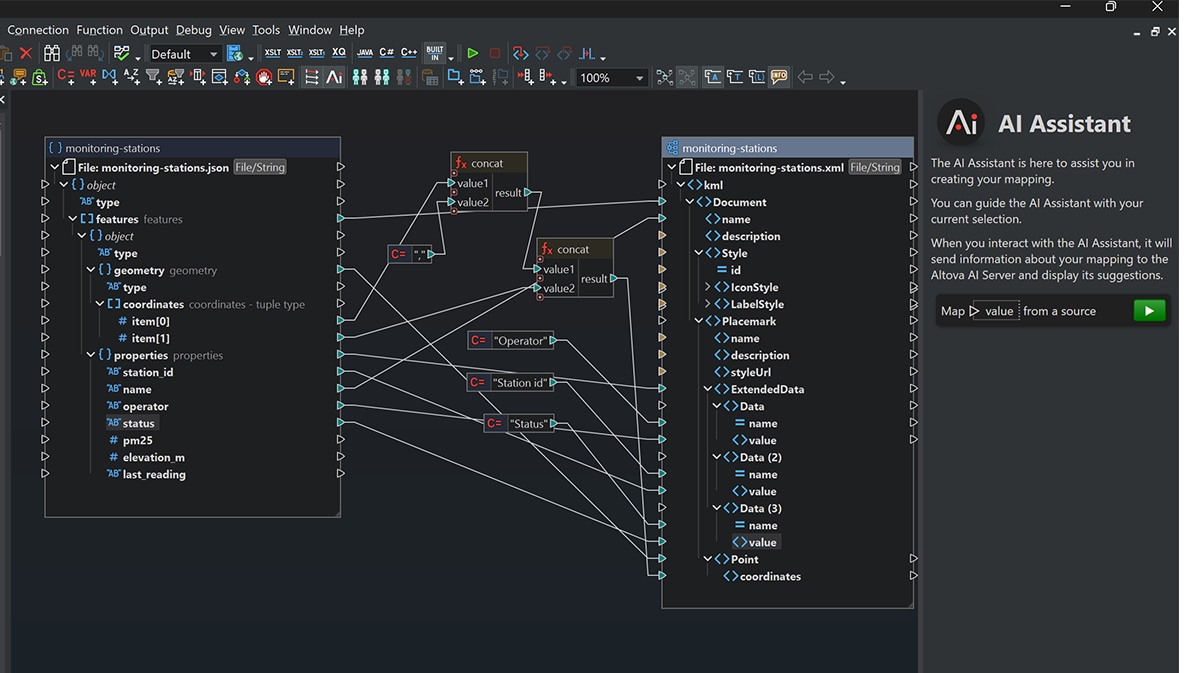
MapForce supports converting geospacial data to numerous formats, and not every conversion is lossless. A tool telling you a conversion succeeded isn't the same as a file that still holds everything you started with. Geospatial formats are used for various purposes: KML was built to display things, GeoJSON to exchange them, CSV to tabulate them. Converting between them means deciding what happens to the parts one format carries and another has nowhere to put. Here's what survives each conversion, and what doesn't.
| Conversion | Geometry | Attributes | Notes |
|---|---|---|---|
| GeoJSON → KML | Preserved | Preserved as ExtendedData | Styling has no GeoJSON equivalent and must be added in the mapping |
| KML → GeoJSON | Preserved | ExtendedData → properties | KML styling, icons and folder structure have no GeoJSON equivalent |
| GeoJSON → CSV | Flattened | Preserved as columns | One row per feature; multi-part geometry must be flattened or serialised |
| KML → CSV / Excel | Flattened | Preserved as columns | Nested folders collapse; decide row granularity up front |
| CSV → GeoJSON | Rebuilt from lat/long | Preserved as properties | Column-to-property mapping is explicit; requires valid coordinate columns |
| CSV → KML | Rebuilt from lat/long | Preserved as ExtendedData | Point geometry is straightforward; lines and polygons need construction |
| JSON (REST API) → KML | Constructed | Mapped by field | The common “plot my API data on a map” job |
| GeoJSON / KML → DB | Flattened | Preserved as columns | The repeatable-reporting use case |
Converting between GeoJSON and KML preserves geometry and attributes but not presentation. Converting to a tabular format — CSV, Excel, a database table — flattens geometry, and you decide what "one row" means. Converting from tabular back to a geo format rebuilds geometry from coordinate columns.
Plot REST API output on a map (JSON → KML)
A fleet-tracking, sensor or asset API returns JSON. Google Earth and most mapping viewers want KML. Load the JSON response as a source, load or infer a KML structure as the target, connect the coordinate fields to <coordinates> and the descriptive fields to <name>, <description> and ExtendedData, and run it.
Get geo data into a spreadsheet people will actually open (GeoJSON / KML → Excel or CSV)
The recipient does not have GIS software and does not want it. Flatten features into rows, choose which properties become columns, and hand over an .xlsx.
Turn a spreadsheet of addresses or coordinates into map data (CSV → GeoJSON / KML)
Latitude and longitude columns become point geometry; the remaining columns become properties or ExtendedData.
Load geo attributes into a database on a schedule
Map GeoJSON or KML features into database tables, then run the mapping weekly against a folder of new files.
Unlike free web based tools that ohly support one-off conversions, MapForce lerts you save your data mapping to automate the same conversions on a recurrent basis:
MapForce is a data mapping tool, not a GIS. It moves geospatial data between formats and systems and does it repeatably. It does not do spatial analysis, rendering, or cartography, and it does not reproject between coordinate reference systems. For buffering, intersections, spatial joins or map production, use QGIS or ArcGIS — and use MapForce for the format conversion and database loading around them. Download a free trial to get started.
Yes. Load your JSON file as the source and a KML structure as the target, then connect the fields visually — coordinates to the <coordinates> element, descriptive fields to <name>, <description> and ExtendedData. MapForce infers a schema from your JSON if you do not have one. The mapping is saved as a file, so the same conversion can be re-run on new data.
GeoJSON is a JSON format defined by RFC 7946 and built for data interchange between applications and APIs. KML is an XML format originally from Google Earth and built for display. That difference shows up in what each one carries: KML has styling, icons and folder organization that GeoJSON has no equivalent for. Both describe the same geometry types.
Not directly. Excel cannot interpret KML’s nested placemark structure, so the data has to be flattened into rows and columns first. That means deciding which placemark attributes become columns. MapForce performs the conversion and saves it as a reusable mapping, so additiona KML files convert the same way every time.
No. Format conversion, attribute mapping and loading geo data into a database do not require GIS software.
You need a GIS for spatial analysis and map production — buffering, intersections, cartography. For moving data between formats and systems, a data mapping tool is the lighter and more automatable option.
No. MapForce is desktop software installed on your own machine. Files are read from and written to your local disk or network, and nothing is transmitted to Altova or any third party as part of a conversion.
Yes. MapForce processes batches of files through the same mapping in a single run.
To make it recurring, compile the mapping for MapForce Server and schedule it with FlowForce Server — hourly, nightly, or whenever new files arrive.
It gets flattened. CSV has no nested structure, so each feature becomes a row and you decide what a row represents. Point data maps cleanly to latitude and longitude columns. Lines and polygons have multiple coordinate pairs, so you either serialise the coordinate string into one column or expand to one row per vertex.
No. MapForce maps and transforms the values in your data but does not perform geodetic reprojection. If your source and target need different coordinate reference systems, reproject in a GIS tool first, then use MapForce for the format conversion and everything downstream of it.
