Example: Value Line Charts
The difference between value line graphs and category line graphs is that, in the former, the X-Axis takes numeric values that are the domain of the function whose range is represented on the Y-Axis. For example, for the function y=3x, the Y-Axis plots values that are three times the value of corresponding X-Axis values, for example: (-1, -3) (0,0) (1, 3) (2,6). Category line graphs on the other hand take X-Axis values that are text values and their Y-Axis values are not functions of X-Axis values.
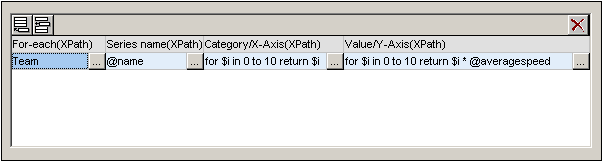
The value line chart examples in this section are located in the (My) Documents folder, C:\Documents and Settings\<username>\My Documents\Altova\StyleVision2026\StyleVisionExamples/Tutorial/Charts. In the first example (see screenshot below), TeamTrials.sps (using TeamTrials.xsd and TeamTrials.xml), the X-Axis show time in hours. The Y-Axis values show distance traveled in time and they are a function of X-Axis values: distance travelled = speed * time.

The XML file contains the speeds of the various teams. The context node for the chart is the TeamTrials element in the XML document. The Z-Axis (Series Axis) selects the names of the teams (Team/@name). The X-Axis is a sequence of integers generated by an XPath expression. The Y-Axis value of each graph (one per team) is derived by multiplying the X-Axis value (hours) by the speed of that team (Team/@averagespeed). The screenshot below shows the XPath expressions that were used to select data for the three axes.
More value line graphs
The second example, ValueLineGraphs.sps (using ValueLineGraphs.xsd and ValueLineGraphs.xml), contains more line graphs (screenshot below).
The XPath expressions (flexible) to select values for the various graphs are shown in the second screenshot below.

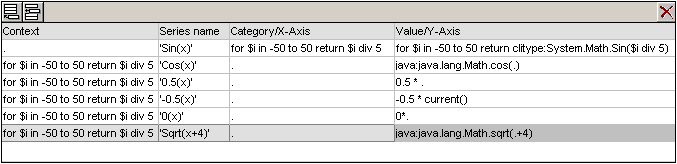
Note the following points about the XPath expressions shown above:
•For the first graph, the X-Axis values are generated with the XPath expression for the X-Axis (Category) data selection.
•For all the other graphs except the first graph, the X-Axis values are generated with an XPath expression that outputs the context node.
•Java functions are called with java:java.lang.Math. We have used two Java functions: cos() and sqrt().
•.NET functions are called with clitype:System.Math. We have used one .NET function: Sin().
•The X-Axis and Y-Axis ticks have been set manually (in the Change Appearance dialog) at intervals of 2 units and 1 unit, respectively.
