Chart Settings: Quick Reference
Chart settings select the chart type and define the appearance of the chart. They are made via the Chart Settings pane (screenshot below) of the Chart Configuration dialog. There are two groups of settings: basic (which are made directly in the Chart Settings pane) and advanced (which are accessed via the All Settings and Dynamic XPath Settings buttons).
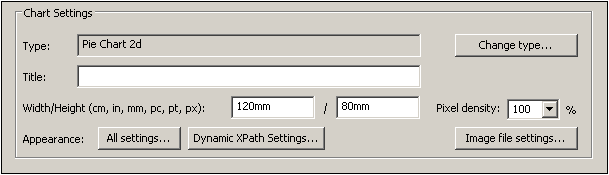
The Image File Settings button pops up a dialog in which the location and name of the image file can be specified. This location is used when a preview is generated or when the Save Generated Files command is used. Image files created for previews are deleted when StyleVision is closed.
This section contains the following parts:
•Basic chart settings, which are the chart settings available in the Chart Settings pane (see screenshot above) of the Chart Configuration dialog.
•Advanced chart settings, which can be accessed via the All Settings button in the Chart Settings pane (see screenshot above).
•Dynamic XPath settings, which can be accessed via the Dynamic XPath Settings button in the Chart Settings pane (see screenshot above).
Basic chart settings
The basic chart settings are: the chart type, chart title, chart width, and chart height.
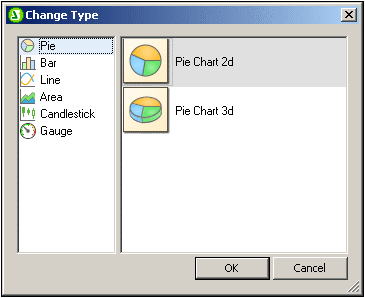
To select the chart type, click the Change Type button and, in the Change Type dialog that pops up (screenshot below), select the chart type you want, and click OK.
The chart's title, width, and height can be entered as static values directly in the Chart Settings pane. If you wish to obtain the chart's title by evaluating an XPath expressions, then the XPath expression for the title must be set in the Dynamic XPath Settings dialog (accessed with the Dynamic XPath Settings button).
The Pixel Density setting specifies the resolution of the chart image in the output. It is set as a percentage of the height and width setting. For example: If a chart is specified to have a height of 250px and a width of 250px, and the pixel density has been set to 200%, then a chart image file is created measuring 500px x 500px. In the output, this image file will be constrained to a width of 250px x 250px, thus producing an image of higher resolution.
Advanced chart settings
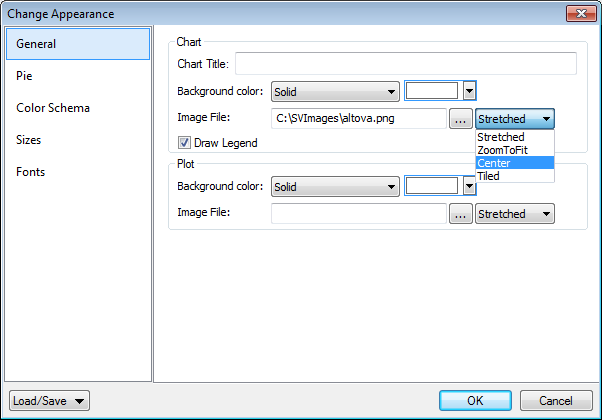
A chart's advanced settings are accessed by clicking the All Settings button in the Chart Configuration dialog (see screenshot above). This pops up the Change Appearance dialog for that particular chart type (the screenshot below shows the Change Appearance dialog of a pie chart).
The advanced settings are organized into the following common tabs:
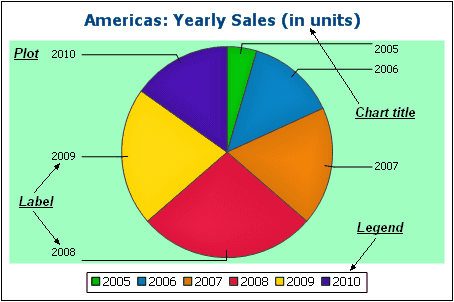
•General: The chart title (see screenshot below) is the same as the basic setting (see above) and can be edited as an advanced setting also. Other settings in this dialog are the background color of the chart and the plot. In the screenshot below, the plot has been given a pale green background color. An image file can also be set as the background image of the chart and/or the plot. This image can be stretched to cover the entire area of the chart or plot; zoomed to fit so that the zoom matches one of the two dimensions (of chart/plot); centered; or tiled. The legend is the key to the color codes in the chart, and it can be turned on or off.
•Color scheme: Four predefined color schemes are available plus a user-defined color scheme. You can modify any of the color schemes by adding and/or deleting colors to a scheme. The color scheme selected in this tab will be used in the chart.
•Sizes: Sizes of various aspects of the chart can be set, either as pixels or as a percentage ratio.
•Font: The font properties of the chart title and of legends and labels can be specified in this tab. Sizes can be set as a percentage of the chart size or absolutely as points.
•Load/Save button: Settings can be saved to an XML file and can be loaded from an XML file having the correct structure. To see the structure, save the settings of a chart and then open the XML file. Clicking this button also gives you the option of resetting chart settings to the default.
Additionally, each type of chart has settings specific to its type. These are listed below:
•Pie charts: Settings for: (i) the angle from which the first slice should be drawn; (ii) the direction in which slices should be drawn; (iii) the outline color; (iv) whether the colors receive highlights (in 3D pie charts: whether dropshadows and transparency are used); (v) whether labels should be drawn; and (vi) whether values and percentages should be added to labels and how many decimal places should be added to the percentages.
•Bar charts: Settings for: (General) Drawing the X and Y axes exchanged generates a horizontal bar chart; (Bar) Bar outlines and dropshadows (dropshadows in 2D bar charts only); (X-Axis) Label and color of the x-axis, and vertical gridlines; (Y-Axis) Label and color of the y-axis, horizontal gridlines, the range of values to be displayed, and the tick marks on the y-axis; (Z-Axis, 3D only) Label and color of the z-axis; (3D) the vertical tilt, horizontal rotation, and the width of the view.
•Line graphs: Settings for: (General) Drawing the X and Y axes exchanged; (Line) including the plot points or not; (X-Axis) Label and color of the x-axis, and vertical gridlines; (Y-Axis) Label and color of the y-axis, horizontal gridlines, the range of values to be displayed, and the tick marks on the y-axis.
•Gauge: Settings for: (i) the angle at which the gauge starts and the angular sweep of the scale; (ii) the range of the values displayed; (iii) the interval and color of major and minor ticks; (iv) colors of the dial, the needle, and the border.
•Area: The transparency of areas can be set as a value from 0 (no transparency) to 255 (maximum transparency). In the case of non-stacked area charts transparency makes parts of areas that lie under other areas visible top the viewer. Outlines for the areas can also be specified.
•Candlestick: The fill color can be specified for the two situations: (i) when the closing value is greater than the opening value, and (ii) when the opening value is greater than the closing value. In the latter case, the Series color is also available as an option. The Series color is specified in the Color Schema tab of the Change Appearance dialog.
Dynamic XPath Settings
Dynamic XPath Settings are very useful if you wish to use dynamic data from the XML document in the settings of the chart. For example, the title of a chart about a Region element might need to have data about that Region element (such as its name) in the title of the chart. If there are several Region elements, any one of which will be used at a time for the chart, then the data for the chart title can only be obtained dynamically via an XPath expression. The Dynamic XPath Settings dialog enables such data to be accessed via XPath expressions.
The Dynamic XPath Settings dialog (screenshot below) is accessed by clicking the Dynamic XPath Settings button in the Chart Settings pane of the Chart Configuration dialog. A number of chart settings can be entered in this dialog.
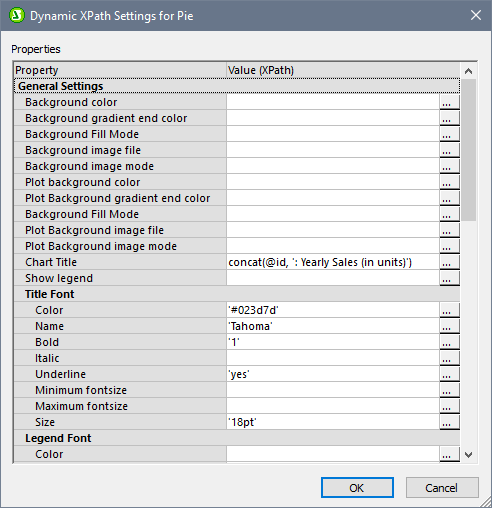
Note the following points:
•All entries in this dialog are evaluated as XPath expressions, so string literals must be enclosed in quotes. For example: 'Tahoma', '1', '18pt', and '#3366FF'.
•On hovering over a setting or its value, a tooltip appears giving information about enumerations and formats.
•The Dynamic XPath Settings have precedence over settings made in the Chart Configuration dialog or Change Appearance dialog. For example, a chart title made as a dynamic XPath setting has precedence over one set in the Chart Configuration dialog.
•The colors of the color schema will be used when the User-Defined color schema is selected in the Change Appearance dialog as the color schema to use. Colors are set in the RGB hexadecimal format: #RRGGBB. So an XPath expression to specify the color red would be: '#FF0000'.