Chart Data Selection: Simple
In the Chart Data Selector pane of the Chart Configuration dialog, the Simple option enables the data selection to be visualized as a table. We will use the XML document below to explain the visualization.

<?xml version="1.0" encoding="UTF-8"?> <Data xmlns:xsi="http://www.w3.org/2001/XMLSchema-instance" xsi:noNamespaceSchemaLocation="YearlySales.xsd"> <ChartType>Pie Chart 2D</ChartType> <Region id="Americas"> <Year id="2005">30000</Year> <Year id="2006">90000</Year> <Year id="2007">120000</Year> <Year id="2008">180000</Year> <Year id="2009">140000</Year> <Year id="2010">100000</Year> </Region> <Region id="Europe"> <Year id="2005">50000</Year> <Year id="2006">60000</Year> <Year id="2007">80000</Year> <Year id="2008">100000</Year> <Year id="2009">95000</Year> <Year id="2010">80000</Year> </Region> <Region id="Asia"> <Year id="2005">10000</Year> <Year id="2006">25000</Year> <Year id="2007">70000</Year> <Year id="2008">110000</Year> <Year id="2009">125000</Year> <Year id="2010">150000</Year> </Region> </Data> |
In the SPS design we insert a chart inside the Data node. In the Chart Data Selector pane (screenshot below) we make the data selection as shown in the screenshot. Since the chart has been inserted within the Data node, the context node for the For-Each expression is the Data node.
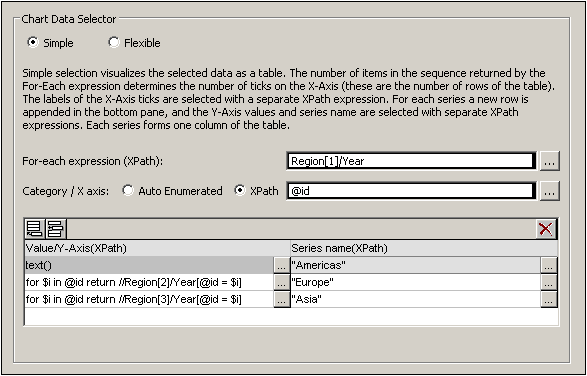
The chart data table can be visualized as the table below. What happens is that for each Region[1]/Year element a row is created and the X-Axis and Y-Axis XPath expressions are evaluated within the respective Region[1]/Year element's context.
For-Each XPath | X-Axis | Y-Axis for Series | ||
Americas | Europe | Asia | ||
Region[1]/Year[1] | @id | text() | XPath-1 | XPath-2 |
Region[1]/Year[2] | @id | text() | XPath-1 | XPath-2 |
Region[1]/Year[3] | @id | text() | XPath-1 | XPath-2 |
Region[1]/Year[4] | @id | text() | XPath-1 | XPath-2 |
Region[1]/Year[5] | @id | text() | XPath-1 | XPath-2 |
Region[1]/Year[6] | @id | text() | XPath-1 | XPath-2 |
•The For-Each expression Region[1]/Year returns six nodes (which become the rows of the table). The number of items in the sequence returned by the For-Each expression determines the number of ticks on the X-Axis.
•The XPath expression for the X-Axis returns the @id attribute value of each Region[1]/Year element. These values will be the labels of the X-Axis ticks. If there are more labels than ticks then extra ticks will be generated so that all labels are plotted. If there are fewer labels than ticks, then the latter ticks (for which no corresponding labels exist) will be unlabelled. The Auto-Enumerated option generates a sequence of integers starting with 1, and assigns each integer sequentially to an X-Axis tick.
•The XPath expression for the Americas series (text()) returns the content of each of the Region[1]/Year elements. This expression could also have been one similar to that for the Europe and Asia series (explained below)—as long as it efficiently returns the values we want.
•The XPath expression for the Europe series is: for $i in @id return //Region[2]/Year[@id=$i]. This expression does the following: (i) looks for the current Region[1]/Year/@id attribute value, (ii) returns the content of the Region[2]/Year element that has the same @id value as the @id value of the current Region[1]/Year element.
•The XPath expression for the Asia series works in a similar way to the XPath expression for the Europe series.
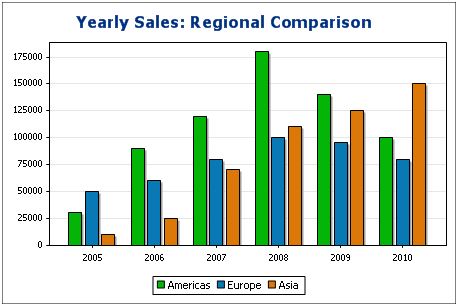
The bar chart generated with this data selection would look something like this:
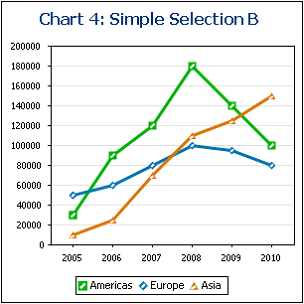
And the line graph chart for this data selection would look like this:
The data selection described above is that for one of the line graphs contained in the example SPS file YearlySales.sps. The SPS design is based on the XML Schema YearlySales.xsd and it uses YearlySales.xml (XML file screenshot above) as its Working XML File. All three files are located in the (My) Documents folder, C:\Documents and Settings\<username>\My Documents\Altova\StyleVision2026\StyleVisionExamples/Tutorial/Charts.
If the For-Each expression returns items that are not nodes
Since the number of X-Axis ticks is primarily dependent on the number of items returned by the For-Each XPath expression, the XPath expression in the screenshot below (distinct-values(//Year/@id)), which returns the six unique year values, will also generate six ticks on the X-Axis. The items returned by the sequence, however, are atomic values, not nodes. Consequently, although they can be used as context items, they cannot be used as context nodes for locating nodes in the XML tree. They can, however, be used to locate nodes on the basis of the equality of values—which is how we will use them.
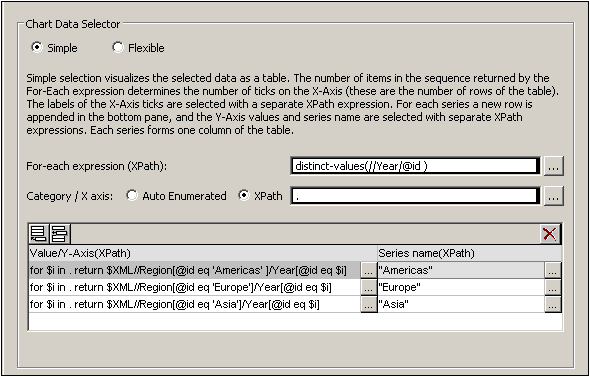
In the data selection shown in the screenshot above, note the following:
•The X-Axis and Y-Axis data selections use the atomic values returned by the For-Each expression, respectively, as direct output and as filter test values.
•Location steps in XPath expressions start at the document node (the $XML in $XML//Region...). This is necessary because the atomic values provide no locational context.
The chart data table would evaluate to the following:
For-Each XPath | X-Axis | Y-Axis for Series | ||
Americas | Europe | Asia | ||
2005 | 2005 | XPath-1 | XPath-2 | XPath-3 |
2006 | 2006 | XPath-1 | XPath-2 | XPath-3 |
2007 | 2007 | XPath-1 | XPath-2 | XPath-3 |
2008 | 2008 | XPath-1 | XPath-2 | XPath-3 |
2009 | 2009 | XPath-1 | XPath-2 | XPath-3 |
2010 | 2010 | XPath-1 | XPath-2 | XPath-3 |