Chart Basics
In this section we present simple examples to illustrate how charts work. These charts are in the SPS file SimpleCharts.sps. The SPS design is based on the XML Schema YearlySales.xsd and it uses YearlySales.xml (screenshot below) as its Working XML File. All three files are located in the (My) Documents folder, C:\Documents and Settings\<username>\My Documents\Altova\StyleVision2026\StyleVisionExamples/Tutorial/Charts.

<?xml version="1.0" encoding="UTF-8"?> <Data xmlns:xsi="http://www.w3.org/2001/XMLSchema-instance" xsi:noNamespaceSchemaLocation="YearlySales.xsd"> <ChartType>Pie Chart 2D</ChartType> <Region id="Americas"> <Year id="2005">30000</Year> <Year id="2006">90000</Year> <Year id="2007">120000</Year> <Year id="2008">180000</Year> <Year id="2009">140000</Year> <Year id="2010">100000</Year> </Region> <Region id="Europe"> <Year id="2005">50000</Year> <Year id="2006">60000</Year> <Year id="2007">80000</Year> <Year id="2008">100000</Year> <Year id="2009">95000</Year> <Year id="2010">80000</Year> </Region> <Region id="Asia"> <Year id="2005">10000</Year> <Year id="2006">25000</Year> <Year id="2007">70000</Year> <Year id="2008">110000</Year> <Year id="2009">125000</Year> <Year id="2010">150000</Year> </Region> </Data> |
After opening the SPS file in StyleVision, check the chart settings to see how data has been selected for the two axes. Do this by right-clicking the charts and selecting the Edit Chart Settings command. This pops up the Chart Configuration dialog, at the bottom of which is the Chart Data Selector pane with fields for entering the XPath expressions for data selection (screenshot below). To view the charts, switch to Authentic Preview.
The four XPath expressions in the Chart Data Selector pane work together and do the following:
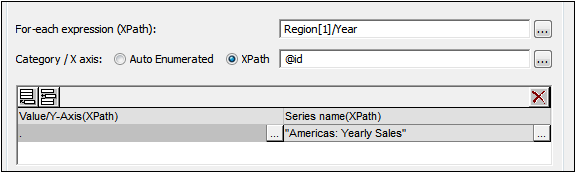
•For-Each XPath expression: (i) Sets the context for the other three XPath expressions; (ii) Sets the number of items in the returned sequence as the number of ticks on the X-Axis. In the case of the screenshot above, the Region[1]/Year expression returns six node items; so there will be six ticks on the X-Axis (see screenshot below).
•X-Axis XPath expression: The items in the returned sequence provide the label text for the corresponding ticks on the X-Axis. In the example shown above, the @id expression returns the id attribute value of each Year element. These values become the labels of the corresponding ticks (see screenshot below). Since we have specified that this will be a bar chart, bars are drawn at the ticks.
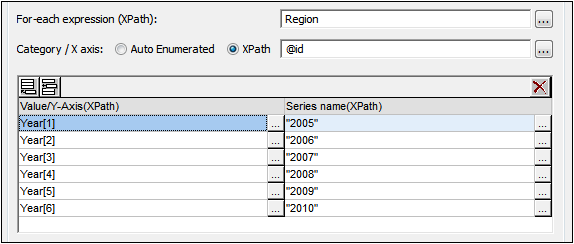
•Y-Axis XPath expression: The Y-Axis can display multiple series, each of which is defined in one row of the Y-Axis table. Each series is defined by two XPath expressions: one for the series value, the other for the series name. In our example, the self::node() XPath expression (indicated by its abbreviated form of a period) selects the current node, which is the Year element that is the context node. So, for each Year element (represented by a bar on the X-Axis), the Year element's content will be read as the Y-Axis value of that year, and therefore plotted as the height of the bar (see screenshot below). The screenshot further below shows a chart with multiple series on the Y-Axis.
•Series Name XPath expression: This expression provides the legend text for the series. In our example, the legend text (which appears at the bottom of the chart, screenshot below) is obtained from an XPath expression that is a text string (see screenshot above).
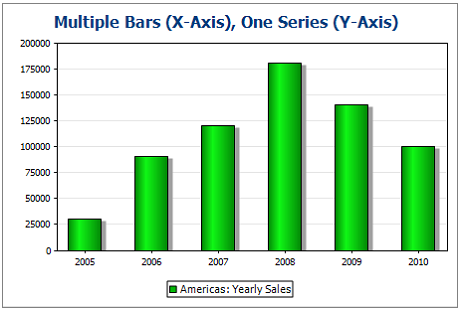
The screenshot above shows a bar chart with a single series, while that below is of a stacked bar chart with multiple series. In the latter example, the value of each series is stacked on to the bar.
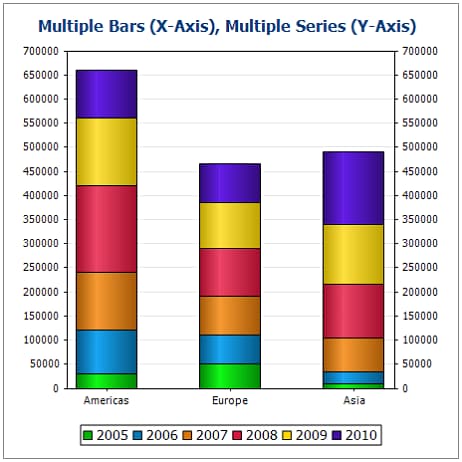
See the chart configuration dialog of the example file SimpleCharts.sps to see how the chart settings were defined. The XPath expressions for this chart are shown in the screenshot below.