Previewing Partially Generated Output
When you are debugging in steps or using breakpoints, you can view the mapping output generated up to the current debugger position. Previewing partially generated output is supported by XML, flat text, and EDI target components.
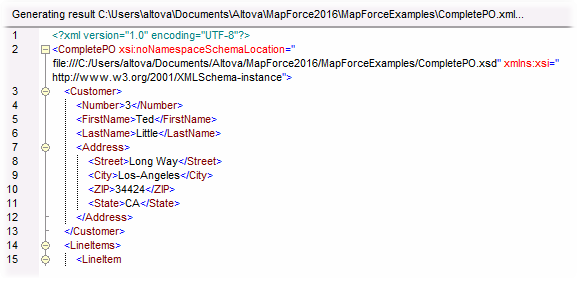
By default, when you press F5 (without having defined any breakpoints), MapForce executes the entire mapping in debug mode, and then switches to the Output pane, displaying the final generated output. However, if you have defined breakpoints, or if you are debugging in steps (F11, or Ctrl + F11), the debugger execution stops while the mapping output is still being generated. Even if the mapping output is partially written at this stage, you can still click to the Output pane, and preview it.
Limitations
•The currently computed target node is not always displayed in the Output pane. For example, XML attributes are collected internally and written at once.
•If the output produces multiple files, only the currently written file can be displayed; switching to another output file is disabled.