Using the Breakpoints Window
The Breakpoints window enables you to view and manage breakpoints globally. By default, the Breakpoints window is displayed when MapForce is in debug mode. If you want to make the Breakpoints window visible at all times, select the menu command View | Debug Windows | Breakpoints when MapForce is not in debug mode.
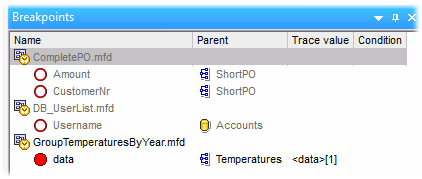
The Breakpoints window displays all breakpoints created since you started MapForce, grouped by the mapping file to which they belong. While MapForce is open, any breakpoints associated with any mapping are "remembered" by MapForce and displayed in the Breakpoints window, even if you closed the mapping file in the meanwhile. The mapping that is currently being debugged is represented with standard text color in the Breakpoints window, while other mappings (the ones that are closed or not active) are grayed out.
You can quickly open any mapping by double-clicking it (or any of its breakpoints) in the Breakpoints window.
Note: Once you close or restart MapForce, all breakpoints are removed.
Information about breakpoints is displayed as a grid with the following columns:
Column | Description |
|---|---|
Name | The name of the node where the breakpoint belongs. |
Parent | The name of the mapping component where the breakpoint belongs. |
Trace value | The value that passes through the connector on which the breakpoint is. The trace value is displayed during debugging execution. |
Condition | If the breakpoint is conditional, this column displays the condition of the breakpoint. |
Breakpoints may be associated with any of the following icons.
Icon | Description |
|---|---|
Active breakpoint. Denotes a breakpoint from the mapping that is currently being debugged. | |
Inactive breakpoint. Denotes a breakpoint from a mapping that is open, but is not currently being debugged. | |
Inaccessible breakpoint. Denotes a breakpoint that cannot be reached by the debugger. | |
Conditional breakpoint. Denotes a breakpoint with a condition attached to it. |
To view or change the properties of a breakpoint:
•Right-click it, and select Breakpoint Properties from the context menu.
To delete a breakpoint:
•Right-click the breakpoint you want to delete, and then select Delete Breakpoint from the context menu.
•Click a breakpoint, and then press Delete.
The context command Delete All Breakpoints removes all breakpoints displayed in the Breakpoints window, regardless of the mapping where they belong.
See also: Adding and Removing Breakpoints