Debugger
MapForce includes a mapping debugger available for the MapForce BUILT-IN transformation language. The mapping debugger helps you achieve the following goals:
•View and analyze the values produced by the mapping at each individual connector level.
•Highlight on the mapping the context (set of nodes) responsible for producing a particular value.
•Execute a mapping step-by-step, in order to see how MapForce processes or computes each value in real time, and preview the mapping output as it is being generated.
•Set milestones (breakpoints) at which the mapping execution should stop and display the value(s) currently being processed.
•View the history of values processed by a connector since mapping execution began up until the current execution position.
The mapping debugger is available when the transformation language of the mapping is BUILT-IN. If you start debugging a mapping designed for a different language, you will be prompted to change the mapping language to BUILT-IN. You can also convert a mapping to BUILT-IN by selecting the menu command Output | Built-in Execution Engine. In either case, the conversion to BUILT-IN will be successful if the mapping does not include components that are not available in the BUILT-IN language (for example, XSLT functions).
The MapForce debugger is unlike a traditional debugger in that it does not traverse your program code line by line (since you do not write any code with MapForce). Instead, the debugger exposes the results of MapForce-generated code produced from the mappings you design. More specifically, the debugger logs values that are passed from and to mapping components through their input and output connectors. The logged values are then available for your analysis directly on the mapping or through dedicated windows.
The following sections highlight various ways in which you can use the mapping debugger.
Debugger settings are available in the Options dialog box. The list of available debugging commands is available in Debug.
Debug with breakpoints
When you need to stop the debugging execution at a particular place in the mapping, you can set breakpoints, similar to how you would do that in a traditional development environment. The difference is that breakpoints are added not to a line of code, but to an input or output connector of a mapping component. You can also add conditions to breakpoints (this can be useful if you want to stop the execution only if the set condition is satisfied).
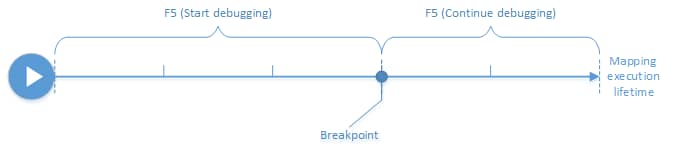
You can define breakpoints on the desired connectors and execute the mapping up to the first encountered breakpoint, then go to the next one, and so on. This way you can analyze the mapping context and values associated with chosen connectors. You can also speed up or slow down the execution by means of the Step Into, Step Out, Step Over, and Minimal Step commands provided by the debugger. These commands enable you to skip portions of the mapping, or, on the contrary, execute portions of the mapping in a more granular way if necessary.
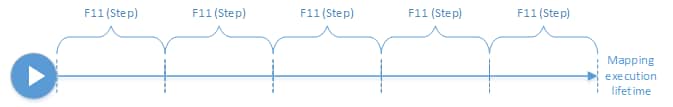
Debug step-by-step
You can debug a mapping step-by-step, and analyze the mapping context and values associated with each step. This scenario is similar to the previous one, in that you can speed up or slow down execution using the Step Into, Step Out, Step Over, and Minimal Step commands.
Analyze the log of values
You can configure MapForce to remember the log of all values (trace history) that were processed by all connectors while you debug a mapping. Keeping the full trace history may not be suitable for mappings that are data-intensive, so this option can be disabled if necessary. When the option is enabled, you can analyze the full log of values processed by each connector up until the current execution position. You can also instruct MapForce to recreate the mapping context associated with any particular value, which would help you understand why that value was produced.
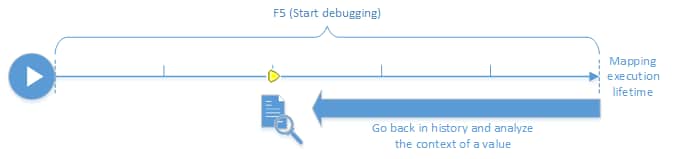
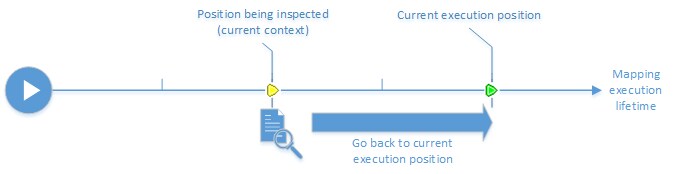
Set the context to a value related to the current execution position
When the debugger is at a particular execution position on the mapping, it is possible to analyze the context of a past value relative to the current execution position (this can be compared to stepping slightly back in time):
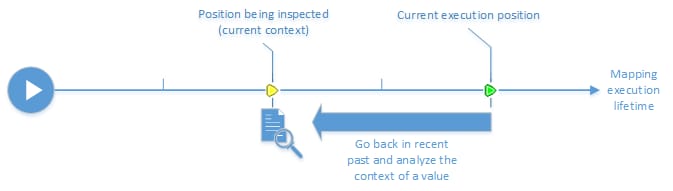
A context is meant to explain why a value is computed; in other words, it describes how a particular value on the mapping came to be generated. The context is normally the current execution position, although it can also be a context in the recent past that MapForce enables you to set. When the context is set to a particular value, MapForce highlights directly on the mapping the nodes that are relevant to it, provides tips next to mapping connectors, and exposes additional information in debugger-related windows (the Values, Context, and Breakpoints windows).
After you have inspected a mapping context that is not the same as the current execution position, you can reset the context back to the current execution position:
Limitations
•When MapForce executes a mapping, it may internally optimize code (for example, by caching data, or by calculating intermediate results at arbitrary points). This may cause certain connectors (and thus breakpoints) to be unreachable for debugging, in which case MapForce displays a notification. Note that the MapForce code optimizations (and, consequently, the behavior exposed by the debugger) may be different from one MapForce release to the other, even though the mapping output is the same for a given mapping.
•The debugger can debug the output generation for one target component at a time. If there are multiple target components on the mapping, you will need to select which one should be executed by the debugger.
•Currently, debugging is not supported for the database table actions (such as "Insert All", "Update If", etc.) of database components.
•Breakpoints cannot be added on any of the following entities: constants, the core | position function, descendent items of "Copy-all" connections, parameters of "inline" user-defined functions.