XSLT Debugging: Finding and Fixing Transformation Errors
For anyone working with XML, XSLT is powerful and essential — but it's also notoriously difficult to debug. Transform a large XML file and get unexpected output? You might spend hours trying to figure out whether the problem is in your template logic, your XPath expressions, or your source data. Without proper debugging tools, XSLT development becomes an exercise in frustration. Let’s explore how the right approach to debugging can save you enormous amounts of time.

This is part 3 in our series on XML Editing. Be sure to check out:
What XSLT Does (and Why It Matters)
XSLT (eXtensible Stylesheet Language Transformations) is the standard way to convert XML from one format to another. You might transform XML to HTML for web display, to CSV for spreadsheets, or to a different XML schema entirely. XSLT is everywhere in enterprise systems, content management, financial data processing, and web applications.
An XSLT stylesheet is a set of template rules that match patterns in your source XML. Each template defines what to output when the XSLT processor encounters a particular element or structure. The processor walks through the source document, matches nodes against templates, and assembles the result. Templates can call other templates, apply conditional logic, loop over node sets, and pull in data from multiple locations in the source. The order of execution depends on the data, not on the order the templates appear in the file.
The power of XSLT is also its complexity. A transformation is essentially a program: it has logic, control flow, variables, and templates. When that program doesn’t produce the output you expected, finding the bug requires understanding what the transform is actually doing at each step.
Why XSLT Debugging Without Tools Is Painful
Imagine you’re transforming an XML document with a 50-template XSLT stylesheet. Something’s wrong with the output, but you don’t know where. Your options without proper debugging tools are grim:
Add logging statements (xsl:message) throughout your stylesheet, run the transformation, read through dozens of log lines, adjust your logging, and run it again. Repeat until you find the bug. This takes hours.
Read through your XSLT source code, trying to mentally execute it and figure out where it might fail. For complex stylesheets, this is nearly impossible.
Simplify your input data to isolate the problem. But that might hide bugs that only appear with real data.
Rewrite sections of the stylesheet, testing each change. This is inefficient and introduces new bugs.
None of these approaches is satisfying. They all burn enormous amounts of time and energy.
Step-Through Debugging Transforms Your Workflow
A specialized XSLT debugger like the one in Altova XMLSpy fundamentally changes how you approach transformation issues. Instead of guessing, you see exactly what’s happening. Here’s how:
Breakpoints and Execution Control
Set breakpoints on specific templates or lines of code, then run your transformation. Execution pauses when it hits a breakpoint, letting you inspect the current state. You can step through line by line, step into called templates, or step over them, advancing to the next template call. This level of control is what you’re used to in regular programming, and it’s just as powerful for XSLT.
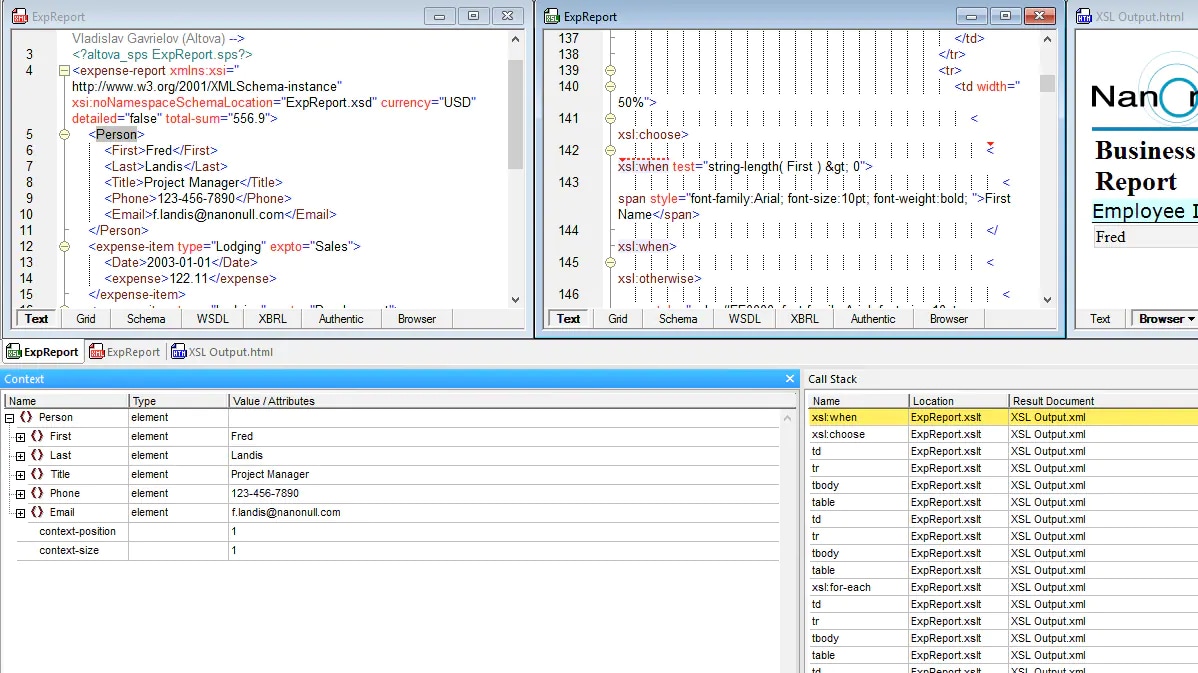
Variable and Context Inspection
As your transformation runs, you can inspect variables, parameters, and the current node context. What value does that variable actually have at this point? What node is currently being processed? Is that XPath expression returning what you expected? A debugger shows you the answers immediately, eliminating guesswork.
Call Stack and Template Tracking
When a template calls another template, which calls another, understanding the execution path is critical. A debugger shows you the full call stack: which template called which, and in what order. This makes it easy to understand the flow and spot logical errors.
Output Tracking
You can see output being generated in real-time as your transformation executes. When output is wrong, you can trace back to which template or instruction generated it, pinpointing the bug.
Step-through debugging is ideal when you know roughly where the problem is. But what about when you're starting from the other direction: you can see something wrong in the output, and you need to work backward to find the cause? That’s where back-mapping comes in handy.
Use Back-Mapping to Perfect Your XSLT
One of the hardest parts of XSLT debugging is answering a simple question: which instruction produced this piece of output? When your transformation generates unexpected results, you're often left tracing through templates manually, trying to connect the output back to the source data and the XSLT that processed it.
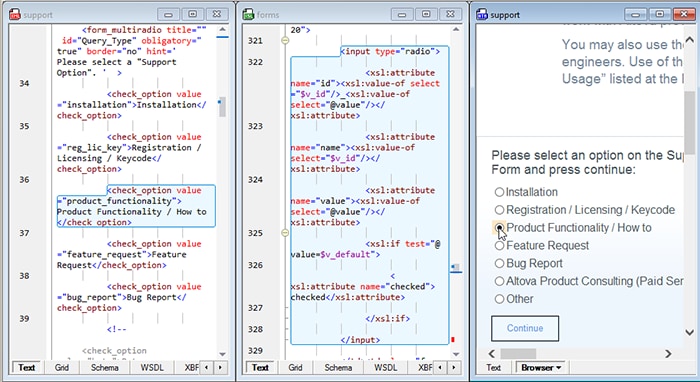
XMLSpy's back-mapping feature solves this directly. Enable it from the toolbar before running your transformation, and the result document becomes interactive. Click on any node in the output and XMLSpy highlights both the XSLT instruction that generated it and the XML source data it drew from. If you're reviewing HTML output in browser view, you can simply mouse over a section and see the corresponding source and XSLT expression highlighted automatically.
You can also tile the source XML, XSLT, and result documents side by side after transformation, so you're looking at all three simultaneously as you trace through the logic.
What makes this particularly notable is how XMLSpy achieves it. The back-mapping works without injecting any additional code or markup into your output document. Your transformation results stay clean — exactly what they'd be without back-mapping enabled. That's a meaningful distinction if you're debugging a transformation whose output feeds directly into a production pipeline.
For anyone maintaining XSLT they didn't write, which is a very common scenario, back-mapping turns what used to be hours of detective work into a few clicks.
XSLT Version Support
XSLT has evolved through multiple versions, each adding capabilities. XMLSpy supports XSLT 1.0, 2.0, and 3.0, so you can work with whatever version your project requires. Modern XSLT 3.0 introduces streaming (for large files), better functions, and improved performance ,but debugging works seamlessly across all versions.
Performance Profiling
Beyond debugging logic errors, a professional XSLT editor includes profiling capabilities. When your transformation is slow, the XSLT profiler shows you which templates are taking the most time. Maybe one template is being called thousands of times unnecessarily. Maybe one XPath expression is inefficient. The profiler quantifies the time spent in each part of your stylesheet, letting you optimize systematically.
For large transformations, this can reduce execution time from minutes to seconds.
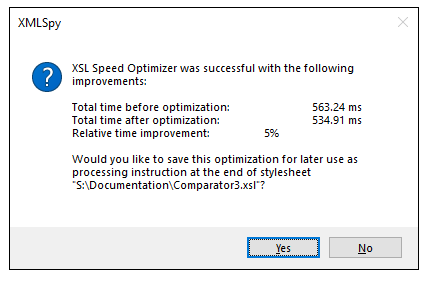
A feature unique to XMLSpy is the XSL Speed Optimizer, which is a patented approach to speeding up XSLT transformations by up to 20% or more. Instead of the developer needing to analyze profiler results and update their file, the XSL Speed Optimizer detects and tests optimizations that they can apply automatically, without needing to rewrite a thing.
Debugging Transforms Your Productivity
XSLT debugging isn’t a luxury for advanced users—it’s essential for anyone working with transformations regularly. XMLSpy integrates a full-featured XSLT debugger that brings you the same debugging experience you’re used to in regular programming.
And, the same debugging tools are available for XPath and XQuery.
Ready to stop guessing and start debugging? Try XMLSpy’s XSLT debugger with a free 30-day trial.