Using Decision Tables to Simplify Data Mapping Logic
A key aspect of any data mapping project is defining data processing rules for transforming data from its source to the target data structure. However, when those rules involve multiple conditions and exceptions, the logic can quickly become tangled and hard to maintain.
If your data mappings are held together by a web of conditionals, you’re not alone. Decision tables simplify that complexity, letting you define business rules in a clean, tabular format that’s easy to read, test, and maintain. For ETL and data integration teams, they deliver maintainability and consistency, especially when implemented directly in MapForce.

What is a Decision Table?
A decision table is a structured way to represent business rules or logic by laying out all possible conditions and the corresponding if/then/else actions in a tabular format.
In one axis you list the various conditions (inputs or criteria), and in the other axis you list the possible combinations or rows of those conditions. Then you map them to actions (outputs or decisions.)
In simpler terms: instead of nesting dozens of if/then/else statements, you capture all possible combinations in a neat grid. A common example of a decision table is one used to guide loan approval using conditions like credit score and income to determine the outcome (approve, reject, or require more information).
| Age | Annual Income | Credit Score | Decision (Output) |
| ≥ 21 | ≥ $60,000 | ≥ 700 | Approved |
| ≥ 21 | ≥ $40,000 and < $60,000 | ≥ 650 | Manager Review Required |
| ≥ 21 | < $40,000 | < 650 | Rejected |
| < 21 | Any | Any | Rejected |
| ≥ 21 | ≥ $60,000 | 600–699 | Manager Review Required |
| ≥ 21 | < $40,000 | ≥ 700 | Manager Review Required |
| ≥ 21 | Any | < 600 | Rejected |
As shown in the example above,
- Each row in the table corresponds to one rule (i.e., one unique combination of conditions) and the resulting action(s)
- The conditions are the input factors (age, income, credit score)
- The actions define what to do when the conditions are met (e.g., approve, reject, or flag for review)
- A balanced decision table means you’ve covered all relevant combinations so you don’t leave any rule undefined
Configuring all these rules separately in a data mapping project can be a nightmare – the mapping becomes crowded and hard to understand, and the likelihood of making an error is higher.
Why Use Decision Tables in Data Integration?
Decision tables are used widely for managing complex, multi-condition rules across industries, and they are particularly useful in data mapping and ETL scenarios where clarity, consistency, and maintainability are critical. Benefits include:
Clarity and readability: Decision tables centralize complex rule logic in a tabular format, making it easier to understand than nested IF statements or scattered code.
Consistency and completeness: By explicitly listing all condition combinations, they reduce the risk of missing edge cases or undefined rules.
Separation of logic from flow: Decision tables let you manage business rules independently from the ETL transformation for easy maintenance.
Reusability: The same decision table can be applied across multiple mappings or workflows, ensuring consistent outcomes.
Simplified testing and auditing: With all rules visible in one table, teams can review, validate, and update logic easily.
Handles complex criteria efficiently: Multi-condition scenarios become manageable, replacing nested conditionals with a clear, maintainable structure.
Decision Tables in MapForce
Altova MapForce makes data mapping straightforward with graphical representations of source and target data structures, a visual function builder, and drag-and-drop field mapping. Its library of data functions includes a decision table component that lets you define multiple rules for handling data in one place, then condense them into a single, easy-to-understand MapForce function that applies the defined rules to incoming data.
You define input conditions and output actions, populate the rules, and connect sources and targets. MapForce then evaluates each record against the table, producing the correct output while keeping your business logic visible, maintainable, and fully integrated into the ETL or data mapping workflow.
To show how this works, let’s look at another common example where a decision table comes in handy: calculating discount percentages. In this scenario the discount is based on a combination of customer status (VIP, regular, or new customer) and purchase amount.
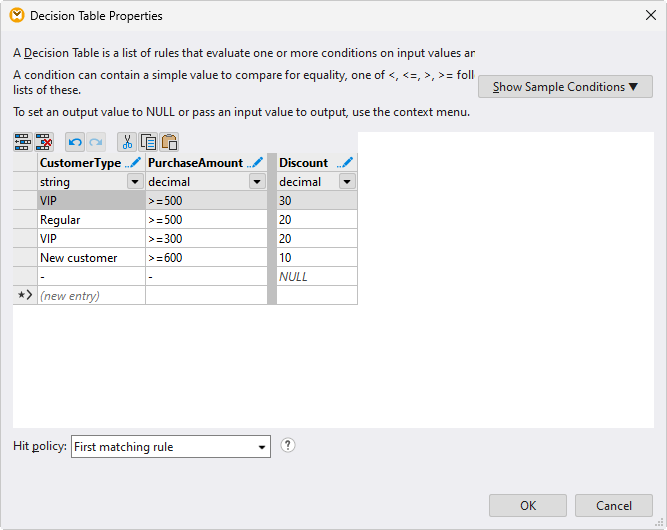
| Customer Type | Purchase Amount | % Discount |
| VIP | ≥ 500 | 30 |
| Regular | ≥ 500 | 20 |
| VIP | ≥ 300 | 20 |
| New customer | ≥ 600 | 10 |
It’s easy to enumerate the possible combinations in the MapForce decision table component for any number of inputs:
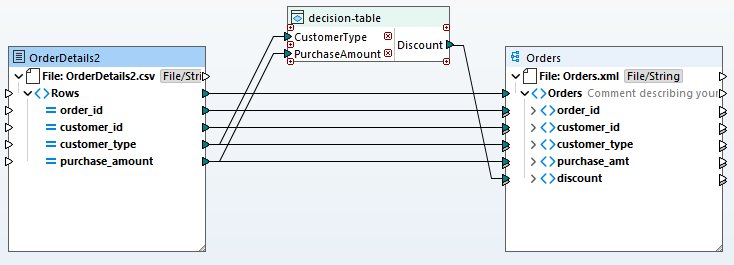
With the conditions and rules defined, the decision table is collapsed into a compact data processing function and inserted in the data mapping project. Here, you can connect the decision table inputs to the source fields in the mapping and connect the output(s) to the target field(s).
At runtime, MapForce will execute the table logic as part of the transformation to write the appropriate discount percentage to the target.
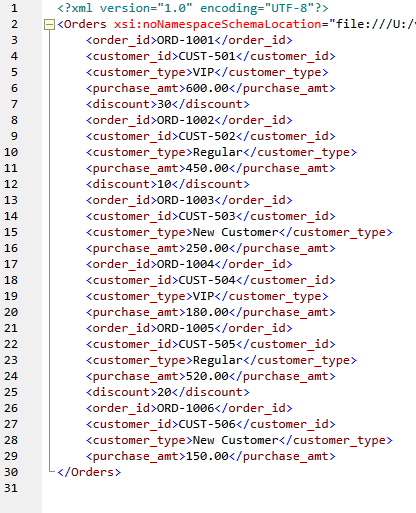
Testing the output of the mapping shows the desired result:
Of course, this is a simple example, but in real-world projects MapForce can handle complex mappings with multiple sources, layered transformations, and large decision tables — all visually, without burying your logic in code or requiring a complex string of conditional functions.
Create Your Own Decision Table
Decision tables turn the tangled web of conditionals in your data mappings into a clear, maintainable structure. By centralizing business rules in one table, you reduce errors, eliminate hidden logic, and improve oversight. Combined with MapForce’s visual approach to data mapping, decision tables can make complex ETL and data integration workflows easier to manage, audit, and update.
You can try this now with a free, 30-day trial of MapForce.