Data Mapping Made Easy
With its visual, drag-and-drop approach, MapForce has always been designed to make data mapping and integration straightforward. In the latest release, two new features make the first steps even easier for users who don’t work with data integration or ETL tools every day. Today’s data analysts, Excel power users, and tech-savvy business users often need to map and convert data as part of their regular workflow, and now they can harness the power of MapForce to get it done.
A new guide bar walks beginners through setting up a mapping project, and a visual component gallery provides a clear, organized way to find and insert the components needed for different data formats and processing tasks.
Together, these additions help new users get oriented quickly and start building their first data mapping project.

Getting Started in MapForce
MapForce already streamlines data integration with its fully visual approach. Users build data mappings by dragging and dropping connections between components, applying transformations with a visual function builder, and previewing results instantly with the built-in execution engine before moving on to automation. This visual workflow eliminates much of the complexity found in traditional data integration and ETL tools.
Now, a new guide bar makes it even easier for beginners to get started. The guide bar is a built-in, step-by-step assistant that walks you through creating a data mapping project from scratch.
First, the guide offers links to several how-to videos that demonstrate various features of the product, from basic XML-to-XML transformations to more complex tasks like one-to-many data integration projects and multi-step ETL workflows. You can start with a video tutorial or just jump right in to start a new data mapping project to convert any of the numerous formats supported by MapForce. Let’s do that now and create a project that maps and transforms XML data to a JSON target.
The guide bar explains the first step, which is to define the data sources for our mapping. We click Insert from Component Gallery… to select our source component.
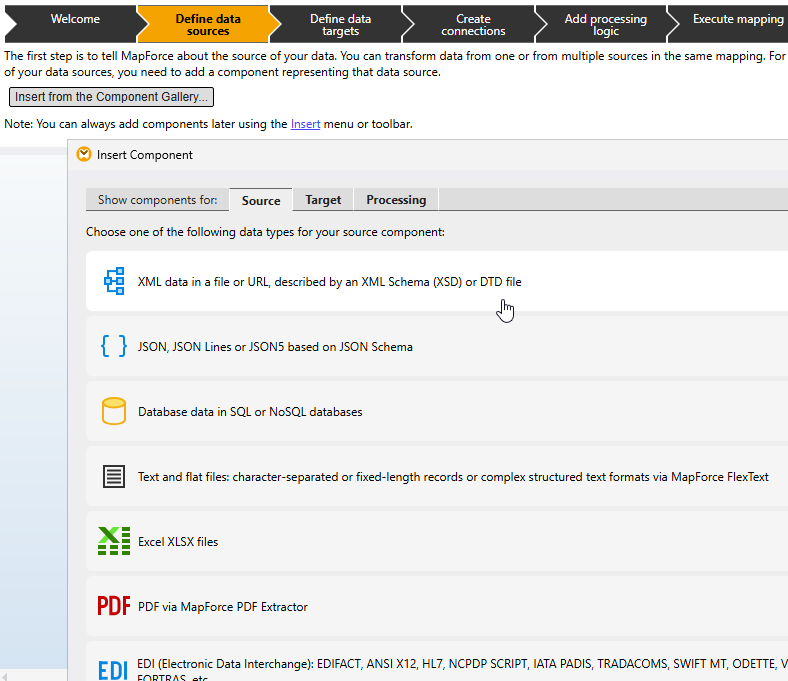
After clicking on XML, MapForce prompts us to select an XML Schema (XSD) that represents the structure of our source. (We have a schema already, but if not, MapForce can infer the structure from an existing instance document.) Once we select the .xsd file, we can also browse to select an instance document that will allow us to preview the results of the transformation with real data.
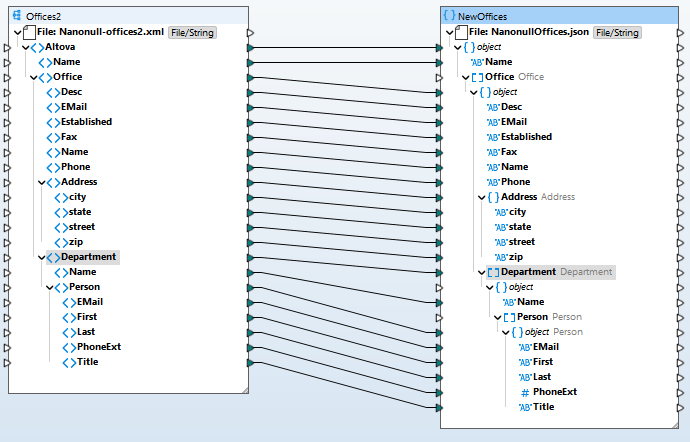
Now our XML source component is displayed in the mapping pane. MapForce displays the hierarchical structure of the data in a tree view for easy understanding and mapping. Our source includes the company’s office locations, contact information, departments, and details for employees in each department.
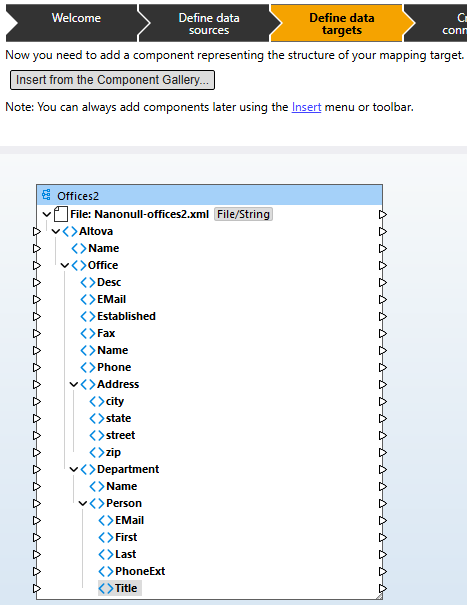
We can also see (above) that the next step in the guide is to define our data target by inserting it from the component gallery. It’s the same process, this time selecting a JSON Schema and sample JSON instance.
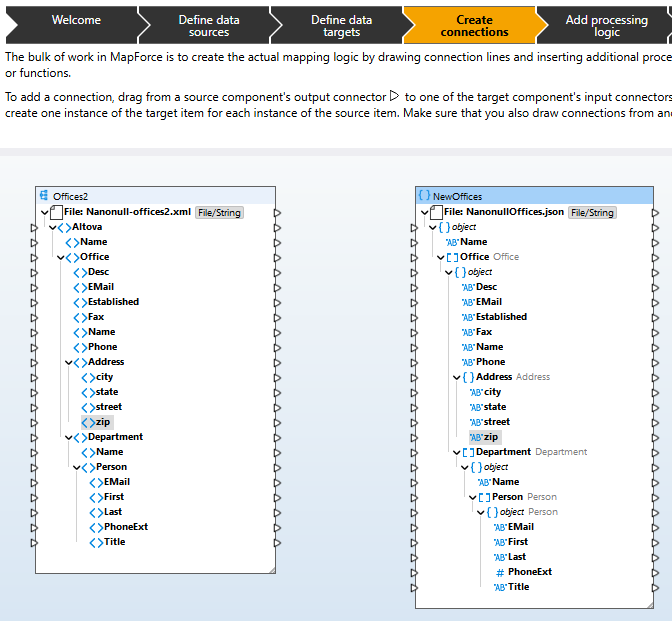
Our example uses a single source and one target, but MapForce lets you define mappings for any number of components. Now the guide explains how to start the mapping by creating connections. We simply drag a source component’s output connector to the corresponding input on the target.
When we connect the Office node in the source to the Office object in the JSON target, MapForce automatically connects all the matching child elements to speed up the process.
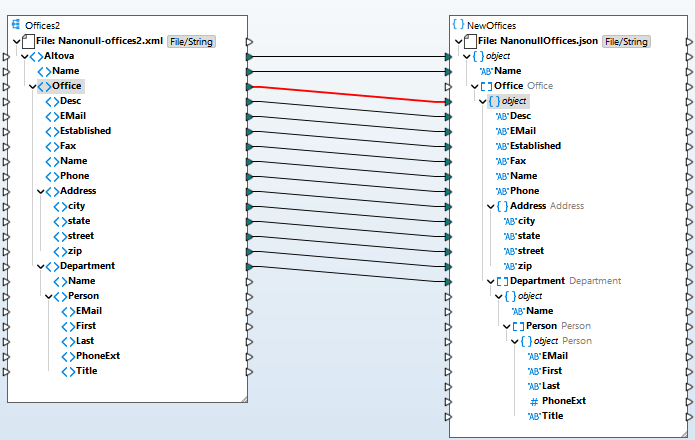
Now we just have to connect the department, name, and person nodes, and MapForce connects those child elements as well.
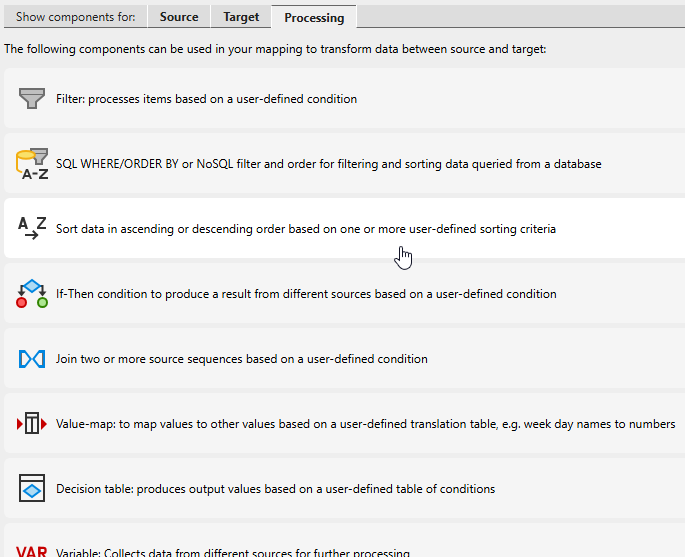
With corresponding fields connected, we could execute our mapping now. But let’s go one step further and add processing logic, which is the next step highlighed in the guide bar. MapForce includes an extensive library of data processing functions that you can use to massage the data before writing it to the target. We can click the Libraries button in the guide to show the complete Libraries pane or choose from the most popular functions listed in the visual component gallery, where they are displayed with colorful icons and helpful descriptions. Let’s use the gallery and insert a Sort function to list the departments alphabetically.
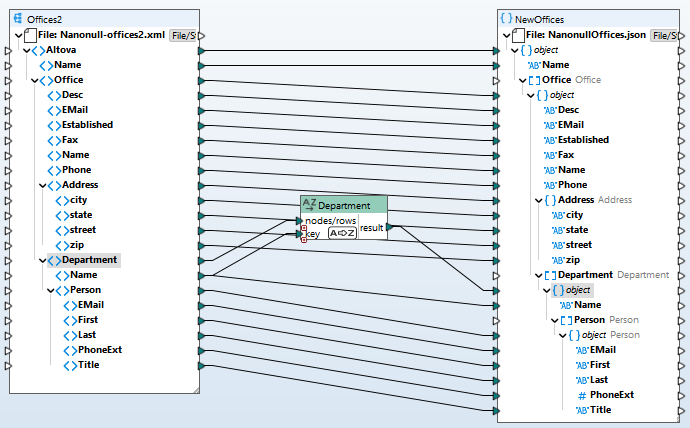
MapForce inserts the Sort function into the mapping and we can connect the Department nodes and the key to sort them by – in this case the department Name.
Now we can click Next in the guide bar to learn how to execute the mapping. For a preview, we can simply click Output below the mapping window to check our work and save the result. Once we’re happy, we can automate the mapping using MapForce Server. Let’s click Output now.
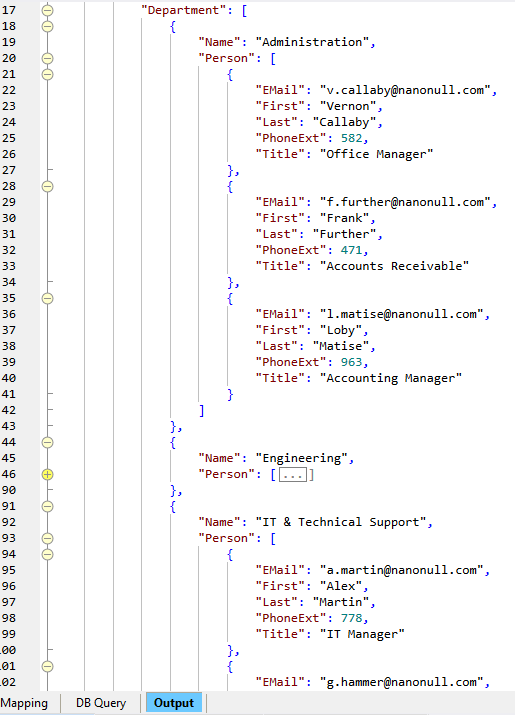
MapForce has converted our sample XML file to JSON, mapped the data properly, and sorted the departments by name alphabetically. We are done with our first mapping!
You can access the guide bar anytime you create a new mapping project, or by opening it via the View menu. And the visual component gallery is always available via the Insert menu for quick selection of a mapping source, target, or processing function.
Define Simple or Complex Data Mapping Logic
As you use the guide bar to learn the ins and outs of MapForce, you’ll find that the software makes it easy to define any type of transformation logic, from the quick sort functionality we implemented here to the most advanced transformation scenarios using conditions, Boolean logic, string operations, mathematical computations, SQL statements, or any user-defined function. You can even use an existing Web service to look up or process data in a mapping.
The MapForce video demo series is also helpful for exploring the full breadth of functionality available for data integration and ETL.
Get Started for Free
Try out the new guide bar and visual component gallery now, available starting with MapForce 2026.