Job Information
This topic describes job monitoring data available on the Home page. The Home page has the following sections: Statistics (Advanced Edition), Running Jobs and Active Timers (see below).
Statistics (Advanced Edition)
The Statistics section of the Home page displays jobs executed in the last 14 days, 24 hours, and 60 minutes. Each of the charts contains bars colored according to the job execution result: success, failure, and interrupted. When you move the mouse over a specific bar on the chart, a tooltip appears with detailed information about the respective time period. For example, in the chart below, the tooltip indicates that one job instance was executed successfully and one job instance was interrupted on January the 27th at 00:00.
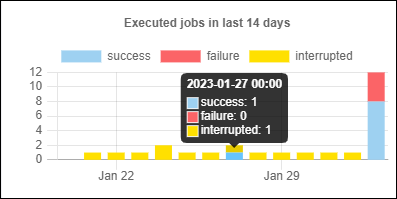
To find out more about a particular piece of information on a chart, double-click the bar of interest in any of the charts. This displays the Log page, with the log pre-filtered for the given minute, hour, or day. There may be slight differences between the statistics displayed in charts and the exact log details tracked by the log. To see a more detailed statistical report, click the link Show more statistics located under the first chart. This opens the Statistics Detail page.
Running Jobs
The Running Jobs section displays up to 10 currently running jobs (see screenshot below).
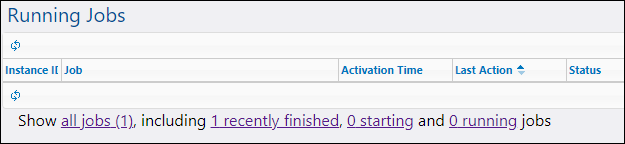
The Running Jobs section contains the following columns:
•Instance ID: When a job instance starts, a unique ID is assigned to it. The instance ID helps you track the execution status of each job instance on the Log page. You can click the instance ID inside the table. This redirects you to the Log page where you can view the details of the selected job instance. If you would like to use the job's instance ID in a job (e.g., to create unique file names), this is possible with the help of the instance-id expression function.
•Job: This column shows the path where you can see the configuration of this job instance.
•Activation Time: Indicates the date and time when the job instance started running.
•Last Action: The date and time of the last execution status.
•Status: The job status as it was when the page was last refreshed. To find out more about job instance statuses, see Job Statuses.
Stop jobs
You can stop any currently running job if your user account (or any roles that your user account is a member of) has the Stop-any-job privilege. Stopping jobs that are still running may cause data corruption and should be done only exceptionally. To stop a running job, take the following steps:
1.Click Home. Any currently running jobs are displayed in the Running Jobs section.
2.Click Stop job. FlowForce Server will ask whether you want to stop the running instance. Click OK.
Stopping the running instance may take several minutes depending on the job type. During this time interval, the job status changes to Aborting or Aborting after step N. As soon as the job instance stops running, the status changes to Aborted or Aborted after step N. If the job instance still cannot be stopped, click Force stop job to stop it forcefully.
All jobs
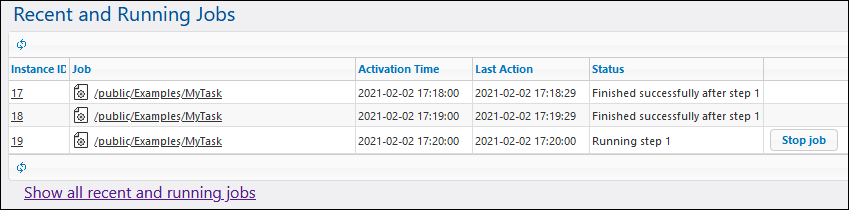
When you click Show all jobs in the Running Jobs section, a new page called Recent and Running Jobs opens (see screenshot below). The table on this page displays all the running and any recently finished jobs, including jobs that failed. Such jobs are displayed only for a short time (approximately 1-2 minutes) after their execution has finished. You can always check the full history of each job instance on the Log page. For more information, see Log. The Recent and Running Jobs page is not refreshed automatically. To get the latest status of all jobs, click the ![]() button (Reload Grid).
button (Reload Grid).
If multiple FlowForce Server instances run as a cluster, the grid includes additional details about the cluster members running each job instance (Advanced Edition). For more information, see Monitor Cluster Members.
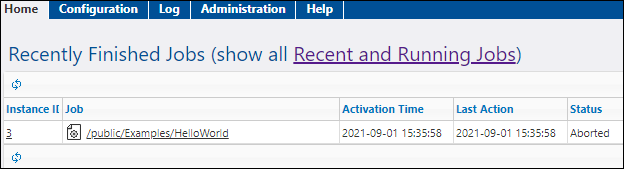
Recently finished jobs
To see finished jobs, click recently finished in the Running Jobs section (see screenshot below). Jobs remain in this list for 90 seconds.
Starting jobs
To see jobs that are about to run, click starting.
Running jobs
To see currently running jobs, click running.
Active timers
The Active Timers section (see screenshot below) displays up to 10 jobs scheduled to run via timers.
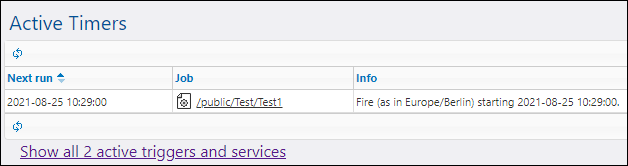
Show active triggers and services
To view the full list of active triggers and services, click Show all active triggers and services (see screenshot above). This opens the Active Triggers and Services page that displays the table with the following columns:
•Type: Indicates the type of trigger. The watch trigger refers to a file system trigger or an HTTP trigger. The Info column provides additional details about the job (see details below).
•Job: Specifies the path of the job where the trigger or the service is defined. Click the link to open the job's configuration page.
•Next run: Applies to watch triggers only. This column indicates when the trigger will run next.
•Info: Provides additional information about jobs running as Web services. For watch triggers and timers, this column summarizes the current configuration of the trigger.
•Service URL: Specifies the URL where the Web service is accessible. This applies only to jobs running as Web services.
Additional information about file triggers
In the Info column on the Active Triggers and Services page, file triggers might have additional information, as shown in the screenshot below (red rectangle).
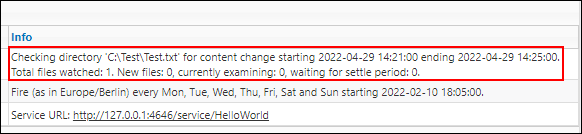
Additional information about file triggers may contain the following messages:
•Total files watched indicates the number of files seen in the directory at the last scan.
•New files shows the number of files that did not exist before the last scan and have not been checked yet.
•Currently examining shows the number of files checked. New files have priority with regard to checking. Then old (already known) files will be checked.
•Waiting for settle period displays the number of files that have been checked and found changed, but these files are waiting for settle time (settle time has been configured to be not zero).
If a trigger encounters an error, this error might be shown as a third line in red (e.g., Error: path must be absolute). Triggers with an error have a red background for the whole row.
The Active Triggers and Services table is not refreshed automatically. Click the  button (Reload Grid) to refresh the page.