Charts Window
The Charts window serves to display selected data from the result grid in a graphical form. It contains nine tabs so that you can produce different charts from a single result grid or from different Result windows.
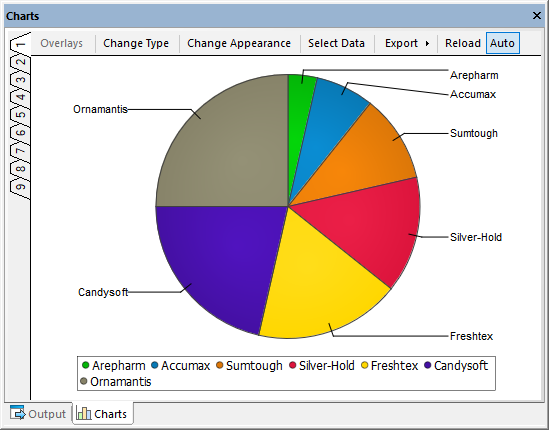
The Charts window provides the following commands:
Command | Description |
|---|---|
Overlays | Lets you to create multiple layers in the same chart window. This button is disabled if the chart type does not support overlays, see Chart Overlays. |
Change Type | Opens the Chart Type dialog box where you can choose between pie, bar, line, and gauge charts and select several sub-types. |
Change Appearance | Opens the Change Appearance dialog box which allows you to define titles, labels, axes, sizes, fonts, and 3d features (if applicable). |
Select Data | Opens the Chart Data dialog box where you can choose the columns that should be depicted on the X- and Y-axes. |
Export | Opens a submenu which allows you to save the chart, copy it to the clipboard or print the chart. |
Reload | Reloads the data from the Result window. If the Auto toggle is activated, data is reloaded automatically when the source data is changed. |
For more information, see Displaying Charts.