Chart Overlays
For some chart types (Bar Chart, Stacked Bar Chart, Line Chart, Area Chart, Stacked Area Chart, and Candlestick Chart), you can display several charts as overlays in one Charts window. This way you can combine charts of different type containing data even from different databases in one Charts window.
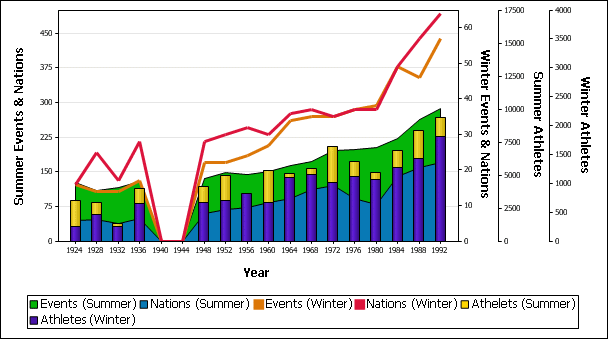
A separate Y axis will be displayed for each overlay chart and can be labeled. Note that an overlay will always be displayed in front of the existing chart(s). You should, therefore, be careful if you combine different chart types in one Charts window as, for example, area charts displayed as overlay may hide bar or line charts. By default, subsequent colors from the color schema of the Main chart will be used for the overlay. You can, however, also deactivate the Use subsequent colors from previous chart layer radio button in any layer and define a different color schema for this particular layer. Note that this color schema will be used for subsequent layers if these have the Use subsequent colors from previous chart layer radio button activated.
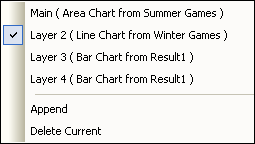
Chart overlays are managed by clicking the Overlays button in the menu bar of the Charts window; this will open the Overlays menu where you can add and remove overlays and select the active chart. Note that any changes you make to chart type and/or appearance, and in the Select data dialog box apply only to the active chart.
Tip: You can use targets for the SQL statements that retrieve the source data of the charts; this way it is easier to identify the various layers in the Overlays menu.
To create a chart overlay:
| 1. | Create a chart (the Main Chart). |
| 2. | In the Charts window, click the Overlays button and choose Append from the drop-down menu. |
| 3. | Do one of the following: |
•Create a new chart from the existing Result window.
•Create a new query in an SQL Editor window or from the Online Browser and click the Show data in Chart window  button.
The new chart is displayed as overlay of the existing chart(s) in the same Charts window.
| 4. | In the Change Type dialog box, which appears automatically for the first overlay of each tab in the Charts window, define the type of the overlay chart. |
| 5. | Optionally, change the appearance of the overlay chart. |
To remove a chart overlay:
1.In the Charts window, click the Overlays button and, in the drop-down menu, select the chart that you want to remove.
2.Select Delete Current from the Overlays menu.
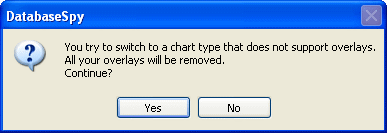
Changing the chart type of the Main chart
When you have selected the Main chart as the active chart, you can change the chart type also to types that do not support overlays (i.e., pie charts and gauge charts as well all types of 3d charts). In such a situation all overlays will be removed from the Charts window and DatabaseSpy displays a warning message.