Chart Data Selection
The Select Data dialog box allows you to add and delete series as well as to define the column or data range that should be illustrated by a particular series. The available columns are displayed in a list box at the bottom of the dialog box. You can add and remove columns by clicking the Select Columns button and activate the required columns in the Select columns dialog box that appears (note that columns can only be added to, or removed from, this dialog box via the Result window).
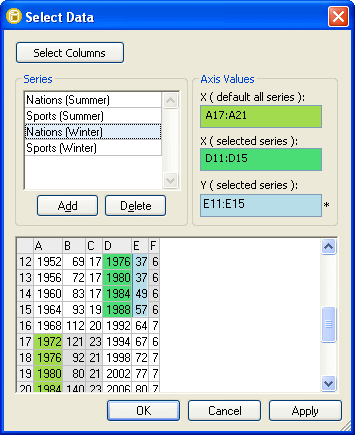
In the Axis Values group box, you can define a column, row, or data range that is used as an X-axis for all series. To specify the column, row, or data range for the Y-axis, select a Series in the Series group box and then click into the Y (selected series) field in the Axis Values group box. An asterisk appears next to the field to mark it as the field that can be edited.
In Value Line Charts, you can add an additional X-axis for the selected series if, for example, the X-axes of two series do overlap but do not match entirely. Then the additional axis can be laid over the default axis, which allows to display the data in the correct place.
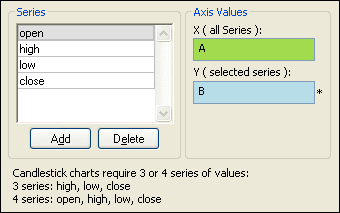
For Candlestick Charts, please note that the sequence of the series is important in order to display the chart correctly. A corresponding note is displayed in the Select Data dialog box.
Adding, deleting, and renaming series
The Series group box shows all the data series that are currently included in the chart. You can rename a series by clicking its name in the group box and enter the new name. A series can be removed from the chart by clicking the Delete button. To add a series to the chart, click the Add button, enter a descriptive name, and assign a column, row, or data range to the Y-axis.
To add a series to a chart:
1.Make sure that the column you want to display in the chart is listed in the list box at the bottom of the dialog box.
2.Click the Add button in the Series group box and give the new series a descriptive name.
3.Click into the Y (selected series) field to select it for editing.
4.In the list box below, click into the column, row, or data range you want to assign to the series (or type the corresponding letter into the Y (selected series) field. You can also select a single value or a value range from the list box.
5.In Value Line Charts, optionally assign an individual X-axis in the same way.
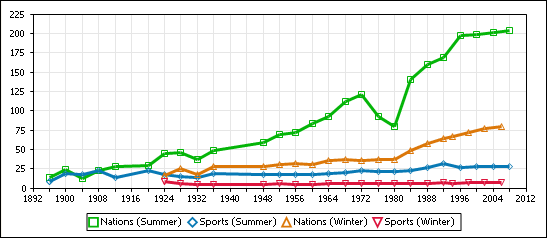
6.Optionally, click the Apply button to see a preview of the new series.
7.Click OK.
Reloading source data
If the result grid that has been used to create a particular chart has changed since the chart was originally generated, the source data has to be reloaded. This can be done either automatically or by clicking the Reload button in the Chart window toolbar. The content of a result grid may change because it is in the Editing mode and the data has been edited—such changes will be depicted in the chart immediately if the Auto toggle is activated—or because the result grid has been closed or the underlying SQL script has been changed and/or re-executed.
If the name of a result grid changes, the connection to the chart is broken and DatabaseSpy displays the Select Result grid dialog box when you click the Reload button or when automatic reloading occurs.
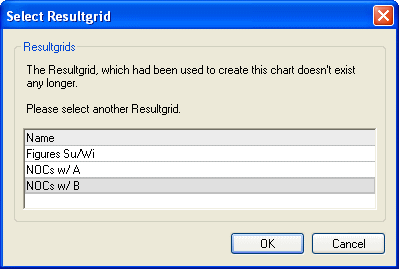
Choose one of the available result grids and click OK.