Displaying Charts
After retrieving data from a database, you can generate a chart that depicts the selected data. Several types of charts, such as pie chart, bar chart, line chart, area chart, or gauge chart, are available and the appearance of the chart can be customized. Charts are displayed in the Charts Window. This is where you can also change the chart type and appearance, define what data is to be displayed and how, or export the chart to file, clipboard, or printer.
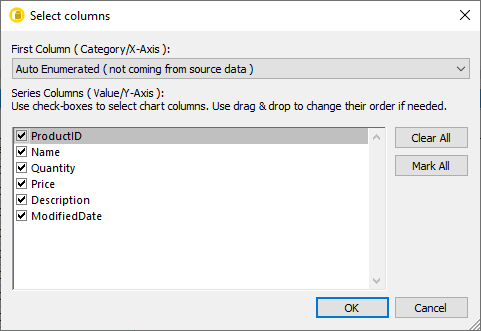
The easiest way to display a chart window in DatabaseSpy is to retrieve data and then click the Show Data in Chart Window ![]() button in the Result window toolbar. This opens a dialog box which lists all the columns that have been retrieved. You can deactivate unwanted columns and change the sequence of the selected columns by dragging them to the desired position in the dialog box.
button in the Result window toolbar. This opens a dialog box which lists all the columns that have been retrieved. You can deactivate unwanted columns and change the sequence of the selected columns by dragging them to the desired position in the dialog box.
Unchecked columns can later be activated again when you choose the chart data in the Chart Data dialog box.
If you have retrieved all columns of a table but want to display only specific columns in a chart, you can select one or several columns in the Result window before you click the Show Data in Chart Window  button. Then only the selected columns will appear in the Select columns dialog box and only these columns can be used for the chart.
You can choose the X-axis for the chart from the First Column ( Category/X-Axis ) drop-down list or leave the default setting "Auto Enumerated (not coming from source data)". In the latter case, all available columns are depicted on the Y-axis and an auto-generated value is used for the X-axis.