Log View
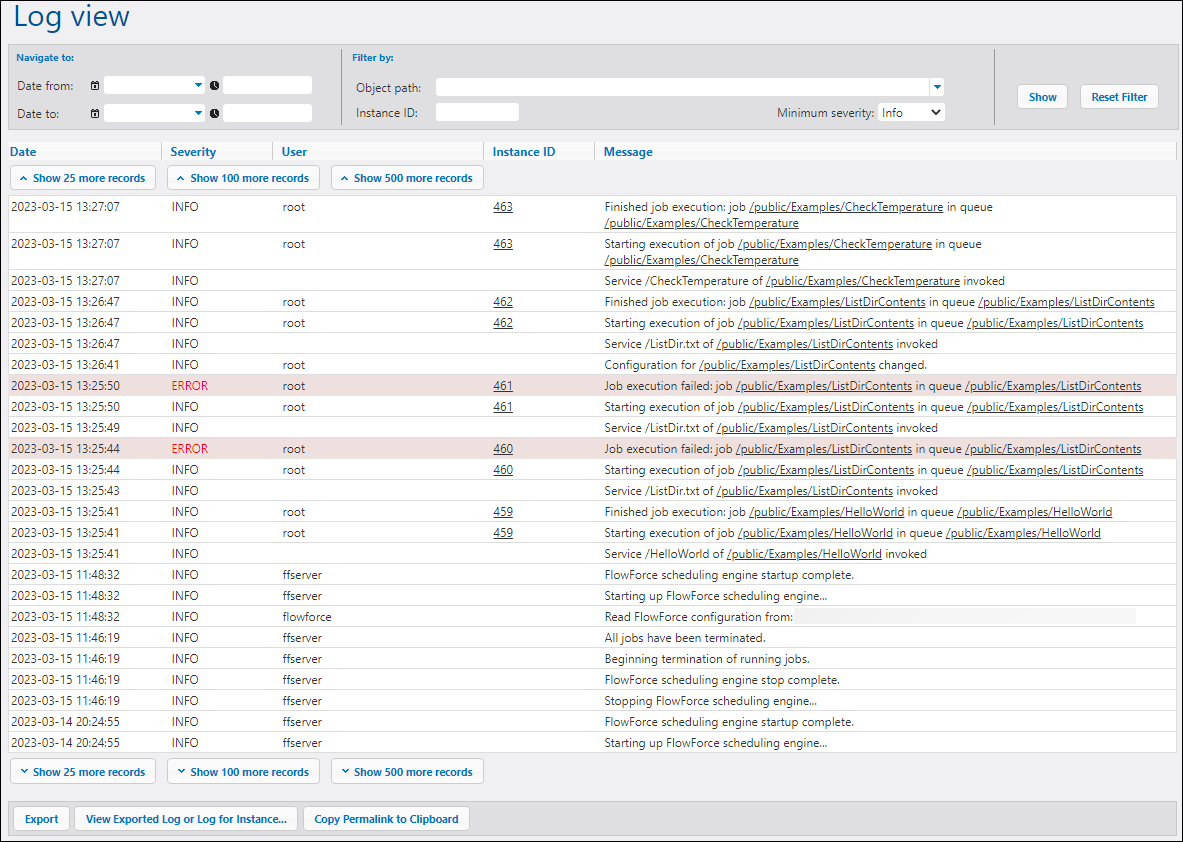
You can view details about various job- and system-related events on the Log View page (screenshot below). To access the Log View page, click the Log menu. For more information about the main parts of the Log View table, the filter options, and the export/copy options, see the subsections below.
Note: By default, you can view the log of any jobs for which you have read-only access. To view the global log of all jobs and events in FlowForce Server, your user account must have the View unfiltered log privilege.
Filters
You can filter log entries using the following criteria:
•Date from: Includes only events after this date.
•Date to: Includes only events before this date. If you set both the Date from and Date to filters, up to 1000 records within that range will be shown. To view additional records, click the Show N more records button. The most recent records are always shown first.
•Object path: Shows events related to an object configured at the specified path (for example, a job or credential record).
•Instance ID: Enables you to see all log entries related to a particular instance ID.
•Minimum severity: Enables you to filter log entries based on severity (explained below).
After modifying the filter conditions, click the Show button or press Enter to apply the filters. Use Reset Filter to clear all filters and refresh the log. Clicking Show without any filters also refreshes the log.
About minimum severity
The following severity levels are available: Verbose, Info, Warning, and Error. The default severity level is Info.
•Verbose: All severity levels will be shown (Verbose, Info, Warning, and Error). The Verbose level is useful for troubleshooting file-system triggers and provides detailed information about the job (e.g., the start and end of directory scanning).
•Info: Information messages, warnings, and errors will be shown.
•Warning: Only warnings and errors will be shown.
•Error: Only the most critical messages will be shown.
Log table
The Log View table has the following columns:
•Date: Indicates the date and time of an event.
•Severity: Indicates the severity level of an event. You can filter messages by severity (see above). The default severity level is Info.
•User: This can be a FlowForce service, a Python security service, or a specific FlowForce user.
•Instance ID: Each run of a job produces a unique job instance whose ID is shown in the Instance ID column. To find out more about a specific instance, click its link in the Instance ID column. For details, see Instance Log. Note that some logged events do not have an ID because it is not applicable (e.g., events related to changes in job configuration).
•Message: Provides information about each log entry. Some log entries may be truncated because the default maximum length of a log entry has been exceeded. To change the length of log entries, configure the logging settings.
To load older records, click Show N more records.
To resize a column in the grid, click any of the vertical bars delimiting the column headings, and, holding the left mouse button pressed, drag to the left or right.
Export, copy, and view log details
The Log View page provides the following functionality to export, copy, and view log details:
•Export All Shown: Enables you to export the log to a file on disk. All records that are currently visible on the page are exported as a JSON file.
•Export All Matching: Becomes enabled when the specified filter conditions are applied. The log records matching the filter conditions are exported as a JSON file.
•View Exported Log or Log for Instance: Enables you to view previously exported log entries (JSON) or a logged instance (a ZIP archive or a JSON file extracted from that ZIP archive). When you view the exported log or instance log, some links in the records (e.g., instance ID links, links to jobs) might lead to an error page because these links are not included in the exported file.
•Copy Permalink to Clipboard: Copies the current URL of the log view to the clipboard, including any selected parameters (e.g., ?id=2773968&limit=25). This is useful if you want to quickly load the same information later. For example, you can paste the permalink into another browser's address bar or send it to someone else so that they can see the same log.
Logging settings
You can configure the following logging settings:
•The default size of log entries
•The level of information displayed in the Instance Log (can be used to diagnose problems with job execution and/or to configure log retention based on the job exit status)